How R1 is scored, where it wins and where it loses, the two ideas that failed, and what R1 still cannot do. We write pass@k and majority voting in Python, and test greedy decoding and few-shot prompts on the 1.5B model.
DeepSeek-R1: Incentivizing Reasoning Capability in LLMs via Reinforcement Learning. Daya Guo, Dejian Yang, Haowei Zhang, Junxiao Song, and others. arXiv 2025 (Nature 2025), 2025. arXiv:2501.12948
A score of 79.8 on a maths test sounds like one clean number. Behind it are choices: which test, which prompt, how many tries, how hot the sampling, and what counts as right. This part reads those choices first. Then it reads the results, the two ideas that did not work, and the four limits the authors list.
Where this part sits, and how §3 scores one question. R1 writes several answers with sampling. pass@1 is the share of right answers; cons@k grades only the most common answer.
Read it from left to right. k is the number of sampled answers to one question. pi is 1 or 0 for the i-th answer. The sum counts the right answers, and k1 turns the count into a share. A tiny example: the model answers one question 8 times and gets p=(1,0,1,1,0,1,1,0). Five are right, so pass@1 is 5/8=0.625.
Why is this better than one greedy answer? First, the two measure different things. Greedy accuracy scores one fixed rule: always take the most likely token. Sampled pass@1 scores the chance that one answer, sampled at temperature 0.6 and top-p 0.95, is right. The two numbers need not be equal.
Second, the sampled score can be measured precisely. For one question, one sample can only say 0 or 1; eight samples can say 0.625, and 64 samples can say it more precisely still. That is why the paper uses more samples on small test sets such as AIME, where each question moves the score a lot.
The paper reports only pass@1, but it cites pass@k from Chen et al. (2021). With k tries, how likely is at least one right answer? That chance is pass@k. This is the natural score for code, where you can run the tests and keep any answer that passes.
pass@k=1−(kn)(kn−c)
Read it for one question. n is the number of samples we drew, c how many of them are right, and k the number of tries we allow. (kn), read "n choose k", is the number of ways to pick k items from n. The fraction is the share of picks that hold only wrong answers. The score of a benchmark is the mean of this over all questions.
A tiny example you can check by hand: n=5 samples, c=2 right, k=2 tries. Call the right samples R1 and R2 and the wrong ones W1, W2, W3. There are (25)=10 pairs. The pairs with no right sample are W1-W2, W1-W3 and W2-W3: (23)=3 of them. So pass@2 is 1−3/10=0.7. Seven of the ten pairs hold a right answer.
With k=1 the formula becomes 1−nn−c=nc, the share of right samples. That is exactly the paper's pass@1. So the paper's formula is the k=1 case of Chen et al.'s.
The binomials get huge fast. (100200) has 59 digits. Chen et al. avoid them with a product. Write out both binomials and cancel the common factors:
(kn)(kn−c)=i=n−c+1∏n(1−ik)
The product has c factors, one per right sample, and each is a number between 0 and 1. No big numbers appear. For the tiny example, n=5 and c=2 give the factors i=4 and i=5: (1−2/4)(1−2/5)=0.5×0.6=0.3. One minus 0.3 is 0.7 again.
Method 1: our own estimator, the product form. One loop over the c factors.
python
def pass_at_k_product(n, c, k):
    """Method 1, our own. n samples, c correct, budget k.
    P(all k picks wrong) = C(n-c, k) / C(n, k) = prod_{i=n-c+1}^{n} (1 - k/i)  (no big numbers)."""
    if n - c < k:                               # fewer than k wrong answers: every k-subset holds a correct one
        return 1.0
    all_wrong = 1.0
    for i in range(n - c + 1, n + 1):           # c factors, one per correct sample
        all_wrong *= 1 - k / i
    return 1 - all_wrong
The first test handles a corner case. If there are fewer than k wrong samples, you cannot pick k wrong ones, so the chance of at least one right answer is 1. Then the loop multiplies the c factors (1−k/i), which is the chance that all k picks are wrong.
Method 2: the formula as written, with exact integers, and the numpy one-liner that Chen et al. print in their Figure 3. A brute-force check lists every subset.
python
def pass_at_k_comb(n, c, k): """Method 2a: the formula as written, with exact integers from math.comb.""" return 1 - math.comb(n - c, k) / math.comb(n, k) # math.comb(a, b) = 0 when b > adef pass_at_k_numpy(n, c, k): """Method 2b: the numpy script of Chen et al., Figure 3.""" if n - c < k: return 1.0 return 1.0 - np.prod(1.0 - k / np.arange(n - c + 1, n + 1))def pass_at_k_brute(n, c, k): """Check: list every way to pick k of the n samples and count the picks that hold a correct one.""" samples = [1] * c + [0] * (n - c) picks = list(itertools.combinations(range(n), k)) good = sum(any(samples[j] for j in pick) for pick in picks) return good / len(picks), good, len(picks)
We ran the three formulas on every n up to 40, every c and every k, and the brute force up to n=10:
plain text
== 2. the unbiased pass@k estimator (Chen et al. 2021)worked example: n=5 samples, c=2 correct, k=2 all 10 pairs listed, 7 hold a correct answer -> 7/10 = 0.700 formula 1 - C(3,2)/C(5,2) = 1 - 3/10 = 0.700 product 1 - (1-2/4)(1-2/5) = 1 - 0.50*0.60 = 0.700all n <= 40, every c and k: max |product - comb| or |product - numpy| = 2.2e-16 (brute force for n <= 10)Chen et al. use n=200: C(200,100) has 59 digits; pass@100 with c=3: comb 0.876884, product 0.876884n = 16 samples per question, c correct: pass@k c | pass@1 pass@2 pass@4 pass@8 pass@16 0 | 0.000 0.000 0.000 0.000 0.000 1 | 0.062 0.125 0.250 0.500 1.000 2 | 0.125 0.242 0.450 0.767 1.000 4 | 0.250 0.450 0.728 0.962 1.000 8 | 0.500 0.767 0.962 1.000 1.000 12 | 0.750 0.950 0.999 1.000 1.000 16 | 1.000 1.000 1.000 1.000 1.000== 3. the shortcut 1 - (1 - c/n)^k is biased: simulationtrue success rate per sample q = 0.1, n = 16, k = 8, 200,000 simulated questions true pass@8 = 1 - (1-q)^8 = 0.5695 mean of unbiased estimator = 0.5685 mean of 1 - (1 - c/n)^k = 0.4898== 4. cons@k: majority vote over k sampled answers plurality right pass@1 0.500 cons (tie=fraction) 1.00 cons (tie=first) 1 own == lib: True plurality wrong pass@1 0.250 cons (tie=fraction) 0.00 cons (tie=first) 0 own == lib: True right but only 3 of 8 pass@1 0.375 cons (tie=fraction) 1.00 cons (tie=first) 1 own == lib: True tie 2-2 pass@1 0.500 cons (tie=fraction) 0.50 cons (tie=first) 1 own == lib: True tie 2-2, wrong first pass@1 0.500 cons (tie=fraction) 0.50 cons (tie=first) 0 own == lib: True unfinished answers pass@1 0.250 cons (tie=fraction) 1.00 cons (tie=first) 1 own == lib: True
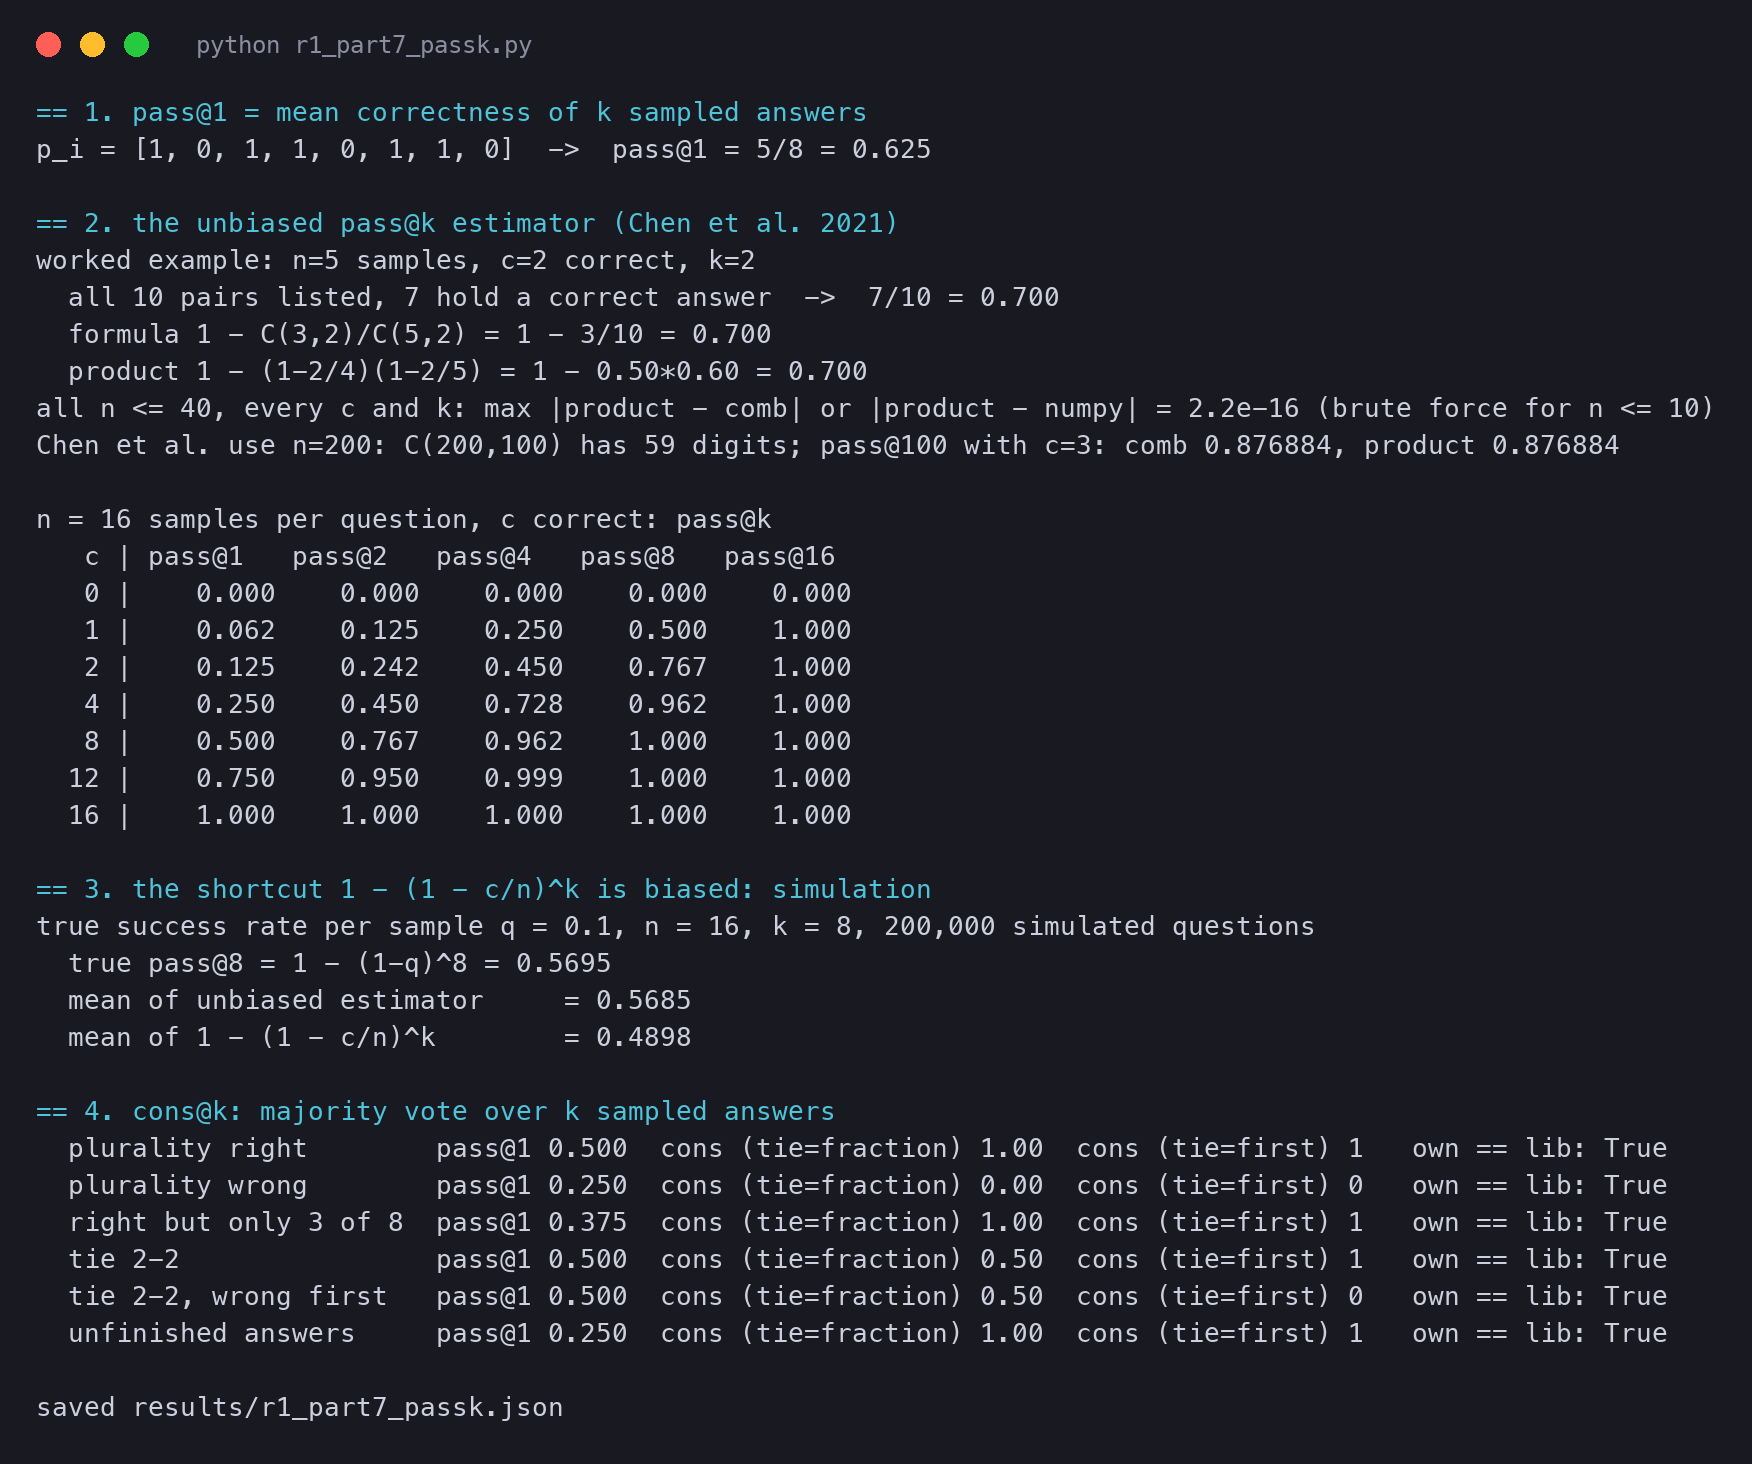
The ten pairs of the tiny example give 0.700 by listing, by the formula and by the product. Over all the cases, the methods differ by at most 2.2⋅10−16, the rounding error of a float. The table is the useful part. With 16 samples of which only 2 are right, pass@1 is 0.125, but pass@8 is already 0.767.
pass@k from our estimator, for 16 samples of which c are right. Even one right sample in 16 gives pass@8 = 0.5: a model that rarely finds the answer still finds it often when it may try many times.
The last two blocks of the output test two more claims. The simulation gives each of 200,000 questions a true success rate of 0.1 per sample, draws 16 samples, and estimates pass@8. The true pass@8 is 1−0.98=0.5695. Our estimator averages 0.5685, close to the truth. The shortcut 1−(1−c/n)k averages 0.4898, far below. This is the bias Chen et al. warn about.
The second test is majority voting. The paper does not say how it breaks a tie, so we wrote two rules. "Fraction" gives half a point when the right answer ties with one wrong answer. "First" lets the answer seen first win.
The third case is the reason cons@64 can beat pass@1 by a lot. The right answer "12" appears in only 3 of 8 samples, so pass@1 is 0.375. But the wrong answers are all different, so "12" still wins the vote and cons@8 is 1.
python
def cons_at_k_own(answers, gold, ties='fraction'):
    """Method 1, our own. answers: k final answers (None = no answer). Count each answer, take the most frequent.
    ties='fraction': a tie between t answers gives 1/t credit if gold is among them; 'first': the earliest wins."""
    counts, first_seen = {}, {}
    for i, a in enumerate(answers):
        if a is None:
            continue                            # an answer that never finished does not vote
        counts[a] = counts.get(a, 0) + 1
        first_seen.setdefault(a, i)
    if not counts:
        return 0.0
    top = max(counts.values())
    winners = [a for a in counts if counts[a] == top]
    if ties == 'first':
        return float(min(winners, key=lambda a: first_seen[a]) == gold)
    return (gold in winners) / len(winners)
Method 2 does the same with collections.Counter(votes).most_common(1) for the "first" rule, and numpy.unique(..., return_counts=True) for the "fraction" rule. The two methods agreed on all six cases. This is how R1-Zero went from 71.0 pass@1 to 86.7 cons@64 on AIME (Part 4). Its wrong answers scatter, and its right answers agree.
The output of r1_part7_passk.py, as it ran for this article.
The paper's claim about greedy decoding is easy to test on the small model. We took the first 8 problems of MATH-500 that have no drawing. For each one, the released DeepSeek-R1-Distill-Qwen-1.5B wrote one greedy answer and 4 sampled answers at the paper's settings. The prompt is the one the model card recommends. It is the problem, then "Please reason step by step, and put your final answer within \boxed{}". The run used a Mac (mps, bfloat16) and a limit of 2,048 new tokens per answer, not the paper's 32,768.
The only difference between the two modes is one line:
math-verify grades the text after </think>. An answer that never closes its thinking has no final answer and counts as wrong. We measure repetition three ways. The repeated 4-gram rate is the share of 4-token windows that already appeared earlier in the same answer. A loop is a tail of 512 tokens that repeats with a fixed period. The last measure is the longest block of tokens that an answer writes twice.
python
def rep_rate(ids, n=4): """Repeated n-gram rate: share of the n-token windows that already appeared earlier in the same answer.""" grams = [tuple(ids[i:i + n]) for i in range(len(ids) - n + 1)] return 1 - len(set(grams)) / len(grams) if grams else 0.0def loop_period(ids, tail=512, need=0.95): """Smallest p <= 256 such that the last `tail` tokens repeat with period p (95% of positions agree).""" t = ids[-tail:] if len(t) < tail: return None for p in range(1, 257): same = sum(t[i] == t[i - p] for i in range(p, len(t))) / (len(t) - p) if same >= need: return p return None
The output, with the few-shot rows left for §5:
plain text
model deepseek-ai/DeepSeek-R1-Distill-Qwen-1.5B, device mps, bfloat168 MATH-500 problems (the first 8 without a drawing), max_new_tokens 2048greedy: 1 answer each; sampling: 4 answers each at T=0.6, top-p=0.95== greedy problem lvl gold tokens hit-limit rep4 tail-rep4 loop correct test/precalculus/807 2 \left( 3, \f... 850 0/1 0.13 0.11 0/1 1/1 test/intermediate_al 5 p - q 2048 1/1 0.43 0.28 0/1 0/1 test/algebra/2584.js 3 \frac{14}{3} 1444 0/1 0.32 0.35 0/1 1/1 test/number_theory/5 3 9 1874 0/1 0.23 0.11 0/1 1/1 test/prealgebra/1622 2 42 891 0/1 0.22 0.16 0/1 1/1 test/number_theory/5 3 27 2048 1/1 0.34 0.18 0/1 0/1 test/precalculus/927 4 90^\circ 2048 1/1 0.35 0.15 0/1 0/1 test/algebra/2036.js 3 3\sqrt{13} 1059 0/1 0.15 0.14 0/1 1/1 total: 8 answers, correct 5/8 = 0.625, hit the 2048-token limit 3/8, loop at the end 0/8, mean tokens 1533 mean repeated 4-gram rate 0.272, in the last 512 tokens 0.183; correct among finished answers 5/5== sample problem lvl gold tokens hit-limit rep4 tail-rep4 loop correct test/precalculus/807 2 \left( 3, \f... 869 0/4 0.15 0.12 0/4 4/4 test/intermediate_al 5 p - q 2048 4/4 0.42 0.33 0/4 0/4 test/algebra/2584.js 3 \frac{14}{3} 1635 1/4 0.33 0.28 0/4 3/4 test/number_theory/5 3 9 1639 0/4 0.21 0.16 0/4 4/4 test/prealgebra/1622 2 42 914 0/4 0.25 0.19 0/4 4/4 test/number_theory/5 3 27 2048 4/4 0.30 0.17 0/4 0/4 test/precalculus/927 4 90^\circ 2048 2/4 0.26 0.15 0/4 2/4 test/algebra/2036.js 3 3\sqrt{13} 1841 0/4 0.17 0.14 0/4 4/4 total: 32 answers, correct 21/32 = 0.656, hit the 2048-token limit 11/32, loop at the end 0/32, mean tokens 1608 mean repeated 4-gram rate 0.261, in the last 512 tokens 0.192; correct among finished answers 21/21== sampled answers: pass@1, pass@k (unbiased, n = 4) and cons@4 (fraction credit on ties) sample pass@1 0.656 pass@2 0.729 pass@4 0.750 cons@4 0.750 fewshot pass@1 0.469 pass@2 0.583 pass@4 0.625 cons@4 0.625 greedy accuracy 0.625 (one answer per problem)== longest block of tokens written twice in one answer greedy mean 29.4 tokens, max 52, answers with a block of 50+ tokens repeated: 1/8 sample mean 23.9 tokens, max 48, answers with a block of 50+ tokens repeated: 0/32 fewshot mean 22.7 tokens, max 52, answers with a block of 50+ tokens repeated: 1/32 greedy, problem test/precalculus/927.json: a block of 52 tokens at token 811 comes again at token 912: | - \(12 \times \frac{1}{6} = 2\) | - \(12 \times (-1) = -12\) | - \(12 \times (-\frac{1}{4}) = -3\)
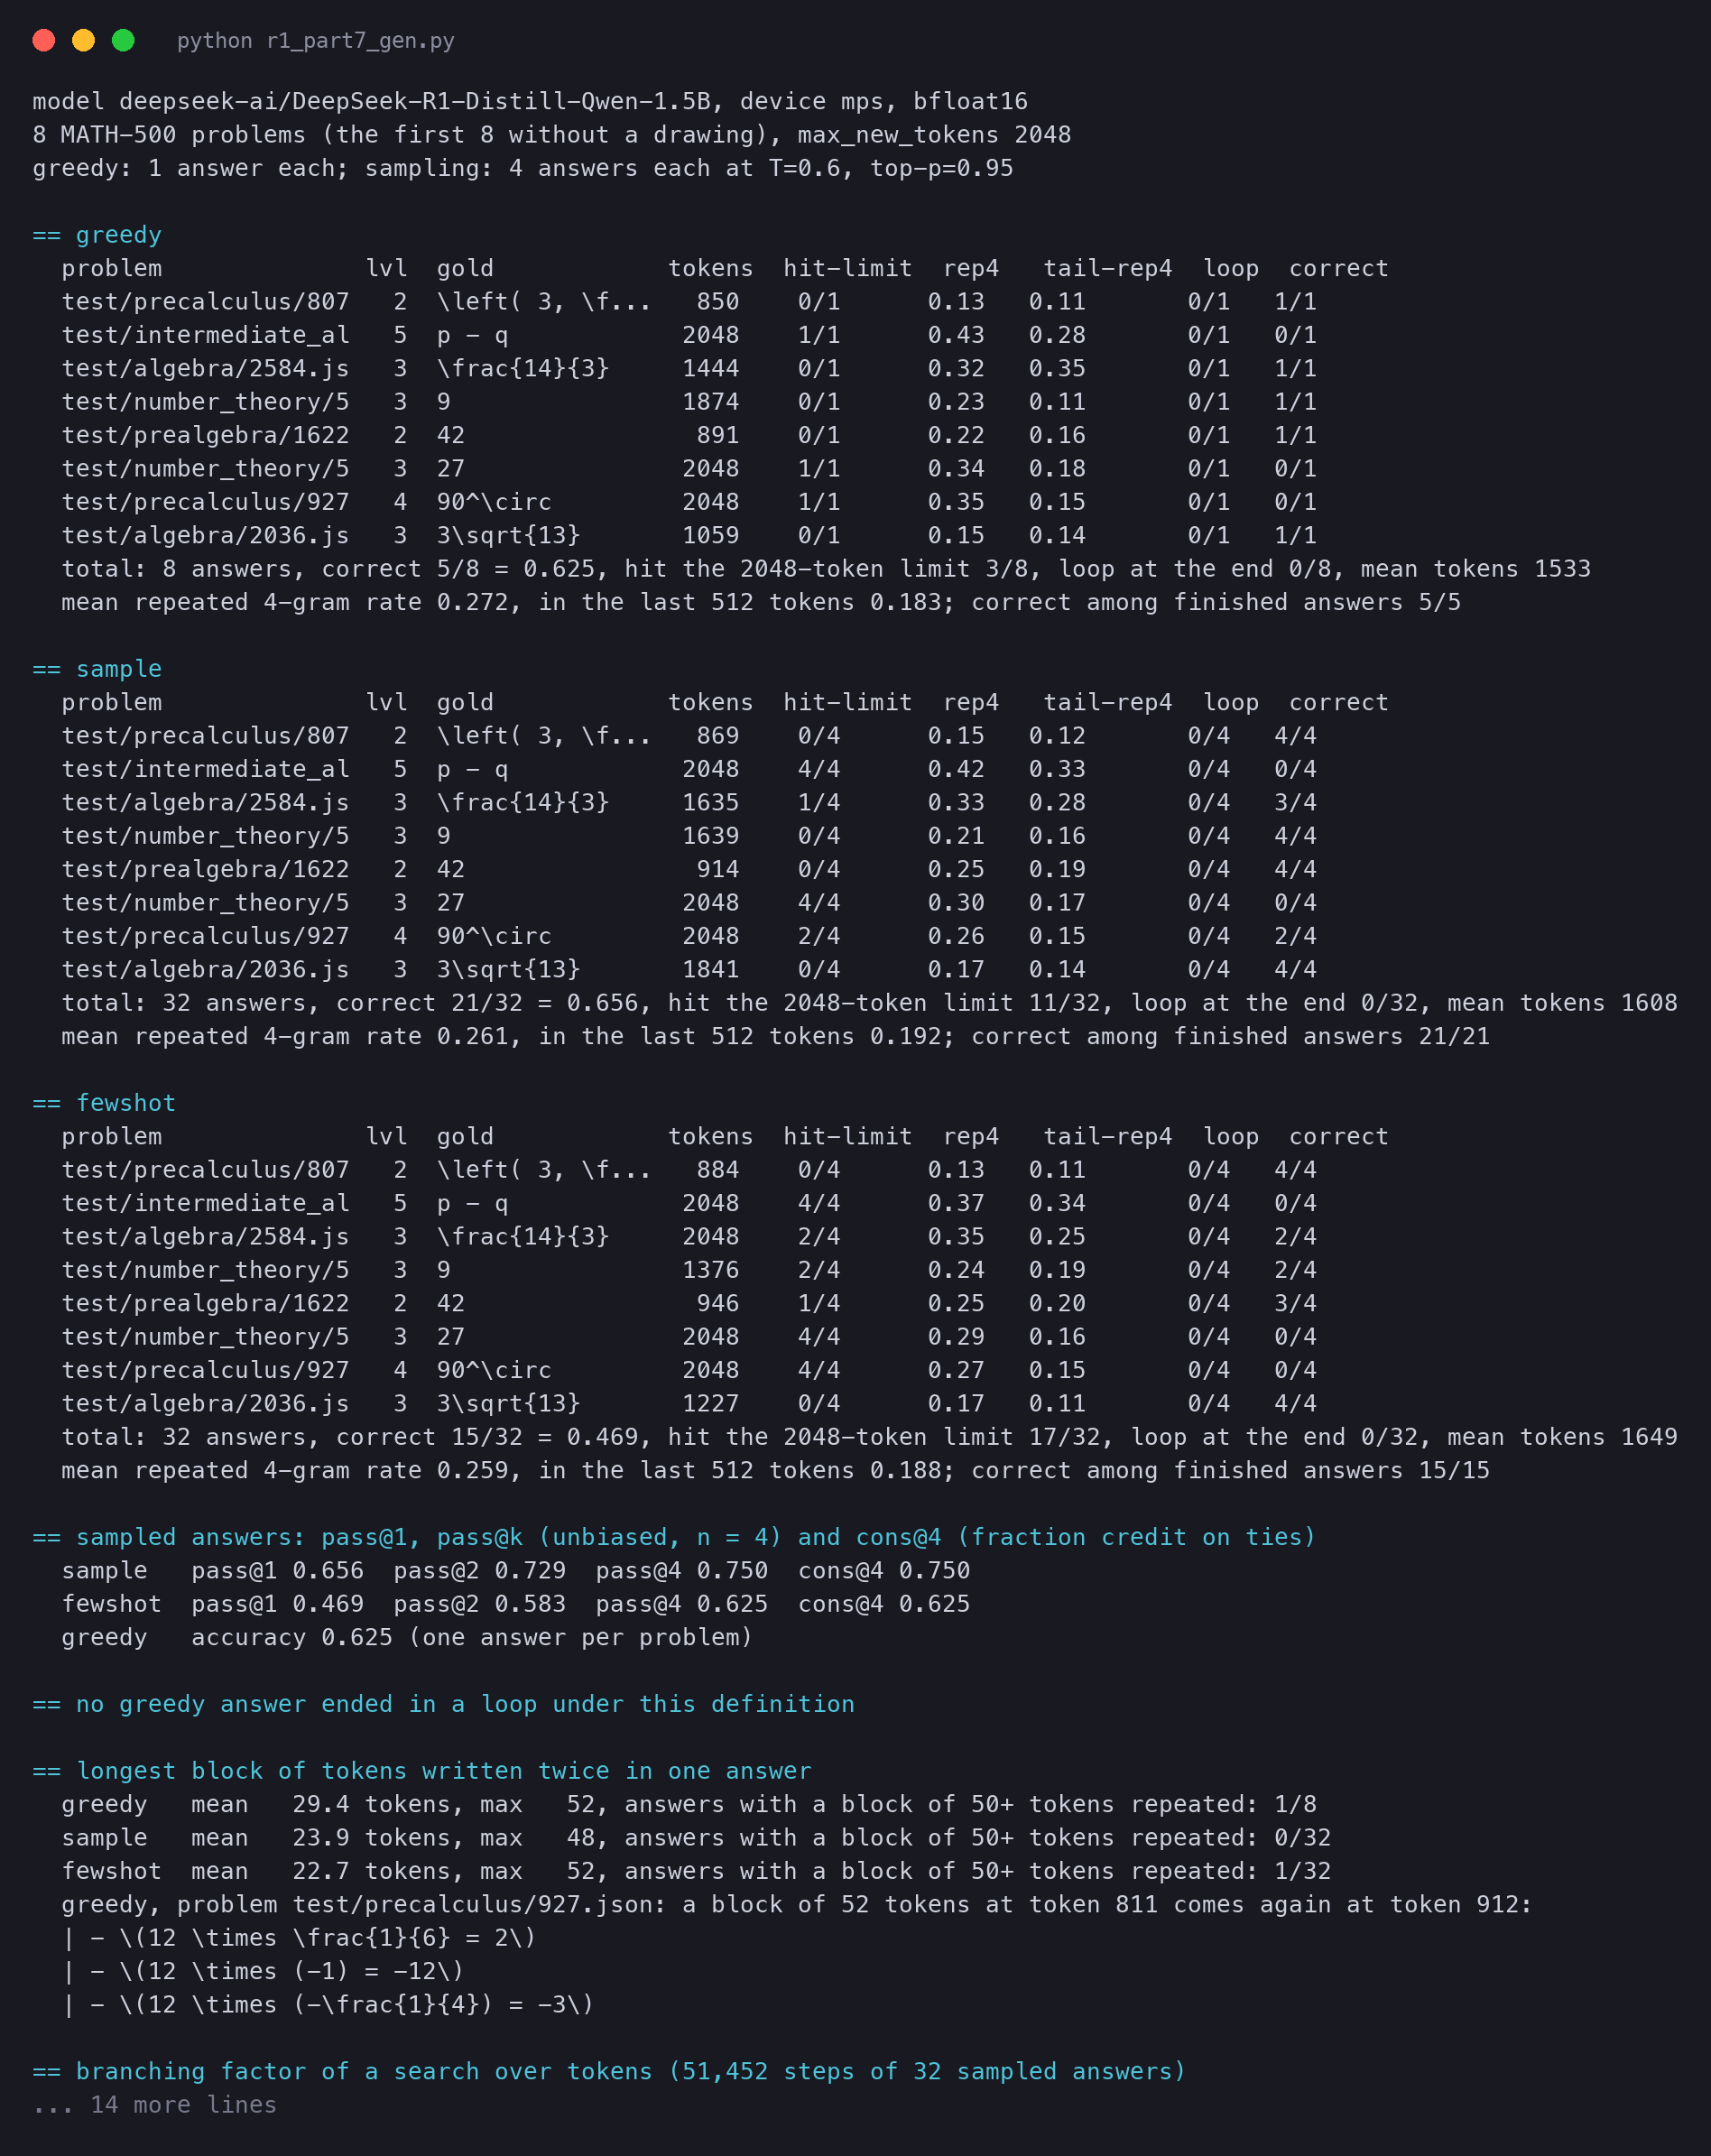
Our run on 8 MATH-500 problems with a 2,048-token limit. Greedy and zero-shot sampling score about the same, and every wrong answer was one cut by the limit. The few-shot prompt is tested in §5 below.
The honest result first: we did not see the repetition the paper describes. No greedy answer ended in a loop. The repeated 4-gram rate is 0.272 for greedy and 0.261 for sampling, almost the same. The longest block written twice is 52 tokens, and it is not a loop. The model recomputes a short list of products while it checks its work.
Our test is small. The paper's claim is about outputs of up to 32,768 tokens from a far larger model, and a loop needs room to form. A 2,048-token limit cuts most long answers before that could happen.
What we did see is the cut itself. Greedy hit the limit on 3 of 8 problems, sampling on 11 of 32 answers. Every answer that finished was right: 5 of 5 for greedy, 21 of 21 for sampling. So on these problems the limit, not the reasoning, decides the score. That is why the paper allows 32,768 tokens.
We also saw the variance argument at work. On the problem with gold answer 90∘, greedy gives 0, but 2 of 4 samples are right, so pass@1 for that problem is 0.5. On the 314 problem, greedy gives 1 and sampling gives 3 of 4. Greedy rounds each problem to 0 or 1; sampling keeps the fraction. Over 8 problems, greedy scores 0.625 and the sampled pass@1 is 0.656.
Table 4 of the paper as a dot chart, by group. Each row joins the lowest and highest of the three scores. R1 (blue) is far right of V3 (green) on maths and competition code, and close to o1-1217 (orange) where both are reported. Bold names are the rows where R1 is behind.
The dot chart shows the pattern at a glance. The longest lines are in maths and code. AIME goes from 39.2 for V3 to 79.8 for R1, and CNMO from 43.2 to 78.8. The Codeforces percentile goes from 58.7 to 96.3.
These are the tasks that reasoning RL trained on, with rewards a program can check. The English knowledge rows move less: MMLU from 88.5 to 90.8. The model already knew those facts; reasoning helps it use them a little better.
The Codeforces rows show a second effect: a rating and a percentile measure the same skill on different scales. R1's rating is 2,029 and o1-1217's is 2,061, a gap of 32 points. Their percentiles are 96.3 and 96.6, a gap of only 0.3. V3's rating of 1,134 gives 58.7. Few human players have high ratings, so near the top a large step in rating moves the percentile only a little. Compare ratings when two strong models are close; the percentile hides their gap.
A PRM is an attractive idea. With an outcome reward, a long solution that goes wrong in step 9 of 10 gets the same zero as nonsense. A teacher who marks each step can say "the first eight steps were good". That is a richer signal, and it should make learning faster.
The second failed idea comes from game-playing programs. To see why it was tempting and why it failed, we need the background first.
Where it comes from. In October 2015, DeepMind's AlphaGo beat the European Go champion by 5 games to 0, the first win of a program over a human professional. The paper appeared in 2016.
Go was the hard case of board games, because the number of possible games is far too large to search. AlphaGo combined two neural networks with a search method called Monte Carlo Tree Search (MCTS). A policy network suggests promising moves. A value network looks at a board and estimates who will win.
AlphaZero (2017) then learned chess, shogi and Go from self-play alone, with no human games.
How MCTS works, in plain words. Picture a tree. The root is the current board, each branch is a move, and each node is the board after that move. The program cannot grow the whole tree, so it grows it where it looks promising. Each round has four steps, shown below. After many rounds, the move from the root with the most visits is played.
One round of Monte Carlo Tree Search. Select walks down the tree along promising children; expand adds one new position; the value model scores it; back-up adds the score to every node on the path, so good branches get more visits next round.
The appeal for language models is clear. Treat the reasoning as a game. A node is a partial solution, a move is the next piece of text, and a win is a right final answer. Search the tree at answer time, and use the best paths found by search as training data. The model then gets better, its search gets better, and the loop repeats, as in AlphaZero.
How large is the tree for a real model? A full vocabulary is the wrong count, because no policy considers every token. A better count asks the model itself. At each step of an answer, how many tokens does top-p sampling at the paper's settings actually allow? That gives the branching factor at each step of the one path the model actually took.
We ran one forward pass over each of the 32 zero-shot sampled answers. At every step we sort the next-token probabilities and count how many tokens it takes to reach 0.95:
python
                    for T, store in ((TEMP, s_a), (1.0, s1_a)):
                        pr = torch.softmax(logits / T, -1)
                        srt = pr.sort(-1, descending=True).values.cumsum(-1)
                        store += ((srt < TOP_P).sum(-1) + 1).clamp(max=pr.shape[-1]).tolist()   # tokens to reach 0.95
Then we multiply the nucleus sizes along one answer, two ways. Method 1 adds their base-10 logarithms. Method 2 multiplies them as exact Python integers and counts the digits:
python
m1 = sum(math.log10(s) for s in one['sizes'])prod = 1for s in one['sizes']: prod *= sdigits = str(prod)
plain text
== branching factor of a search over tokens (51,452 steps of 32 sampled answers) vocabulary: 151,665 tokens in the tokenizer (151,936 rows in the output layer) top-p 0.95 nucleus at T=0.6: median 1, mean 1.59, 90th pct 3, 99th pct 7, max 22, size 1 at 71.9% of steps top-p 0.95 nucleus at T=1.0: median 1, mean 2.64, 90th pct 6, 99th pct 21, max 78, size 1 at 60.9% of steps mean entropy at T=0.6: 0.233 nats== how many different answers could top-p sampling write? one answer (test/precalculus/927.json), 1997 tokens Method 1 (sum of log10 of nucleus sizes): 10^182.1 Method 2 (exact product, count the digits): 183 digits = 10^182.1 Go, b = 250, d = 150: 250^150 = 10^359.7 (exact: 360 digits) chess, b = 35, d = 80: 35^80 = 10^123.5 (exact: 124 digits) whole vocabulary, 1997 tokens: 151,665^1997 = 10^10346 a tree of depth 150 with our median nucleus at T=0.6: 1^150 = 10^0.0
Nucleus sizes over 51,452 steps of our sampled answers. At the paper's temperature of 0.6, 71.9% of steps allow only one token. The rest allow a few, and the largest nucleus we saw had 22 tokens.
The numbers hold a surprise. At T=0.6 the median nucleus has one token, and 71.9% of the steps allow no choice at all. The model is sure of most tokens: the end of a word, the next symbol of an equation. Choices appear at a few places, like which method to try or whether to write "Wait". So a model-guided tree is narrow, not wide.
It is also deep. Take one finished answer of 1,997 tokens and multiply its nucleus sizes. The product is 10182.1, and both methods agree to the digit count of 183. Read this number with care.
It is the size of a hypothetical tree in which every branch copies the branching schedule of this one answer. Step 1 is as wide as our step 1, step 2 as wide as our step 2, and so on. It is not a count of the real tree. A different early token changes every later distribution. So the other branches have their own nucleus sizes and their own lengths. The script's heading ("how many different answers could top-p sampling write?") is only a rough guide to that question.
As an order of magnitude, the number still makes the point. A tree with this schedule is smaller than Go's 10359.7, but no computer can search 10182 paths either. The unrestricted space, all 151,665 tokens at all 1,997 steps, has 1010346 paths. That is the "exponentially larger search space" of the paper.
The size of four search trees, as the number of digits. Chess and Go come from the AlphaGo paper. The two blue bars are for one of our 1,997-token answers: a hypothetical tree that repeats this answer's nucleus size at every step, and the paths through the whole vocabulary.
The count also shows the deeper trouble. In Go, every move is a real decision. In text, the decisions hide among long stretches of forced tokens, and nothing marks where one step ends. That is why the authors made the model write tags at its reasoning steps, and why they capped the children per node. The search still needs a value model that can judge half a solution, and that is the second problem below.
We tested the advice on the same 8 problems. The few-shot prompt puts two short solved examples before the problem: the sum of the first 10 integers, and a linear equation. Everything else stays the same: 4 samples per problem at T=0.6, top-p 0.95, 2,048 new tokens.
plain text
== fewshot problem lvl gold tokens hit-limit rep4 tail-rep4 loop correct test/precalculus/807 2 \left( 3, \f... 884 0/4 0.13 0.11 0/4 4/4 test/intermediate_al 5 p - q 2048 4/4 0.37 0.34 0/4 0/4 test/algebra/2584.js 3 \frac{14}{3} 2048 2/4 0.35 0.25 0/4 2/4 test/number_theory/5 3 9 1376 2/4 0.24 0.19 0/4 2/4 test/prealgebra/1622 2 42 946 1/4 0.25 0.20 0/4 3/4 test/number_theory/5 3 27 2048 4/4 0.29 0.16 0/4 0/4 test/precalculus/927 4 90^\circ 2048 4/4 0.27 0.15 0/4 0/4 test/algebra/2036.js 3 3\sqrt{13} 1227 0/4 0.17 0.11 0/4 4/4 total: 32 answers, correct 15/32 = 0.469, hit the 2048-token limit 17/32, loop at the end 0/32, mean tokens 1649 mean repeated 4-gram rate 0.259, in the last 512 tokens 0.188; correct among finished answers 15/15== sampled answers: pass@1, pass@k (unbiased, n = 4) and cons@4 (fraction credit on ties) sample pass@1 0.656 pass@2 0.729 pass@4 0.750 cons@4 0.750 fewshot pass@1 0.469 pass@2 0.583 pass@4 0.625 cons@4 0.625 greedy accuracy 0.625 (one answer per problem)
The few-shot prompt lowered pass@1 from 0.656 to 0.469 and cons@4 from 0.750 to 0.625. The direction matches the paper's "consistently degrades". The size of the drop means little: it is 6 answers out of 32 on 8 problems.
Look at where the drop comes from. Every finished few-shot answer was right too, 15 of 15. The few-shot answers simply hit the limit more often, 17 of 32 against 11 of 32. Our run cannot tell why. It shows only that the examples did not make the answers shorter or better, and on these problems they made them worse.
The output of r1_part7_gen.py, as it ran for this article (the first 60 lines).
The paper was later revised and published in Nature, received on 14 February 2025 and published online on 17 September 2025. That version keeps the method and the main tables, and adds detail. Its Table 2 scores every stage of the pipeline.
For example, IF-Eval rose from 46.6 for R1-Zero to 83.3 for R1, and AlpacaEval 2.0 from 24.7 to 87.6. The last stages bought the general skills. Its supplement gives the cost: 147,000 H800 GPU hours in all. At an assumed rental price of 2 US dollars per GPU hour, that is 294,000 US dollars.
The rest of the story is in DeepSeek-R1 and reasoning by reinforcement learning, part 4 of our DeepSeek series. It follows the line from R1 to R1-0528, V3.1 with its thinking and non-thinking modes, V3.2, which trained agents that call tools, and V4. Several limits of §5 became the goals of these later models.