vLLM, explained · Part 1 of 6 · Covers Title, Abstract, Figures 1 and 2, §1
The Big Idea: Memory, Not Arithmetic, Limits LLM Serving
How a chat server answers many users at once, why its GPU runs out of memory before it runs out of speed, and the paper's fix: store each request's memory in small pages. We read the title, the abstract, Figures 1 and 2 and §1, and we measure the KV cache of a real model.
Efficient Memory Management for Large Language Model Serving with PagedAttention. Woosuk Kwon, Zhuohan Li, Siyuan Zhuang, Ying Sheng, Lianmin Zheng, Cody Hao Yu, Joseph E. Gonzalez, Hao Zhang, Ion Stoica. SOSP 2023, 2023. arXiv:2309.06180
When many people use a chatbot at once, one GPU answers many of them together. How many it can answer at once depends on memory, and this paper shows that most of that memory was wasted. Its fix comes from the way an operating system hands out memory to programs.
Each piece below shows the exact lines of the paper, then explains them.
The abstract assumes that you know how a chat server works. So we first follow one request from start to end, then add many users, then look at the parts of vLLM.
You type "What is the capital of France?" and press Enter. The text goes to a server with a GPU, and the server cuts it into tokens. Say the prompt is 7 tokens. The model reads all 7 in one pass and writes the first token of the answer, "The". This first pass is the prompt phase.
Then the model writes one token per pass: "capital", then "is", then "Paris", then ".". This is the generation phase. The server sends each new token back at once, which is why a chatbot's answer appears word by word. When the model writes a special end token, the request is done.
During all of this, the model keeps a record of every token it has seen: the KV cache. After the prompt phase it holds 7 slots, one per prompt token. Each step of the generation phase adds one slot. When the request ends, the server frees the memory for the next request.
One chat request over time. The prompt phase reads 7 prompt tokens in one pass and writes the first answer token. Each later pass writes one more token, and the KV cache grows by one slot per step until the end token frees it.
Look at the bottom row of the picture. The cache grows by one slot at every step, and nobody knows when it will stop. The answer could be 5 tokens or 500. The whole paper is about this growing, unpredictable piece of memory.
A server does not answer one user and then the next. Many requests run at the same time, and the server moves them forward together. At every step, it takes the requests that are running and runs one pass of the model for all of them. That group is a batch.
Take four requests, A to D, that arrive at different times. In step 1 only A runs. In step 2, B arrives and joins, so the batch holds 2 requests. A ends after step 5 and leaves. D arrives later and joins in step 6. So the batch changes at every step:
Four requests over eight passes of the model. Each request starts with its prompt phase, then writes one token per pass. Requests join when they arrive and leave when they finish, so the batch size changes from step to step.
Now connect the two pictures. Every request in the batch holds its own KV cache in GPU memory, for as long as it runs. A request can join the batch only if its cache fits. So memory sets the batch size, and the batch size sets the throughput. The rest of this part makes that chain exact.
Here is the whole system that the paper builds, drawn from its Figure 4. Nothing on it is new yet. It is a map for the next parts, so you can see where each piece fits.
The parts of vLLM. Requests enter the scheduler. Inside it, the KV cache manager keeps a block table per request and two allocators. Workers run the model on the GPUs. New tokens go back to the users and to the next step.
Requests from users arrive on the left. In the centre, the scheduler decides which requests run in the next step, as in the grid above. Inside it, the KV cache manager decides where in memory each request's cache lives. It keeps a block table for each request. It also has two allocators: one hands out pieces of GPU memory, and one hands out CPU memory as an overflow area.
On the right are the workers. Each worker drives one GPU. Its cache engine holds the KV cache memory on that GPU, and its model shard holds its part of the weights. After each step, the new tokens go back to the users and to the scheduler.
This part explains why a KV cache manager is needed at all. Part 3 opens the block tables, the allocators and the attention kernel. Part 4 explains sharing, the scheduler's choices when memory runs out, and how the workers split a model across GPUs.
Why serving is memory-bound. Each step reads every weight once, whatever the batch size. In our run, a batch of 1 takes 4.51 ms for 1 token, and a batch of 64 takes 10.01 ms for 64 tokens.
Before we measure the cache, we check why it exists. The attention layers of the model compare the newest token with every earlier token. For that, each earlier token needs two vectors, its key and its value. Without a cache, the model would compute the keys and values of the whole text again at every step. With a cache, it computes them once and keeps them.
We use OPT-125M, the smallest model of the OPT family that the paper serves, in FP16 on an Apple laptop GPU. We write greedy generation three ways: with no cache, with our own loop that keeps a cache, and with the library's model.generate. All three must give the same tokens. In the output, look for two things: the word True on both checks, and the times.
python
@torch.no_grad()def generate_no_cache(ids, n_new): """Recompute the keys and values of every earlier token at every step.""" for _ in range(n_new): logits = model(ids, use_cache=False).logits ids = torch.cat([ids, logits[:, -1:].argmax(-1)], dim=1) return ids@torch.no_grad()def generate_with_cache(ids, n_new): """The prompt phase once, then one new token per step; the cache keeps every earlier key and value.""" out = model(ids, use_cache=True) # prompt phase: all prompt tokens in one pass cache, nxt = out.past_key_values, out.logits[:, -1:].argmax(-1) toks = [nxt] for _ in range(n_new - 1): # generation phase: one token in, one token out out = model(nxt, past_key_values=cache, use_cache=True) cache, nxt = out.past_key_values, out.logits[:, -1:].argmax(-1) toks.append(nxt) return torch.cat([ids] + toks, dim=1), cache
The first function feeds the whole text into the model at every step. The second feeds the prompt once, then only the newest token, and passes the cache back in. The model reads the old keys and values from the cache instead of computing them again:
plain text
== 3. Greedy generation three ways: no cache, our own KV cache loop, model.generate64 new tokens; same tokens, no cache vs our cache: True; our cache vs generate: Truetext: ', a new nation, a new nation, a new nation, a new nation, a new nation, a new nation, a ne' ...cache after generation: 80 tokens = 2,949,120 bytes (the last token gets its key and value at the next step)time: no cache 0.308 s, with cache 0.260 s (1.2x)with a 400-token prompt: no cache 0.633 s, with cache 0.270 s (2.3x)
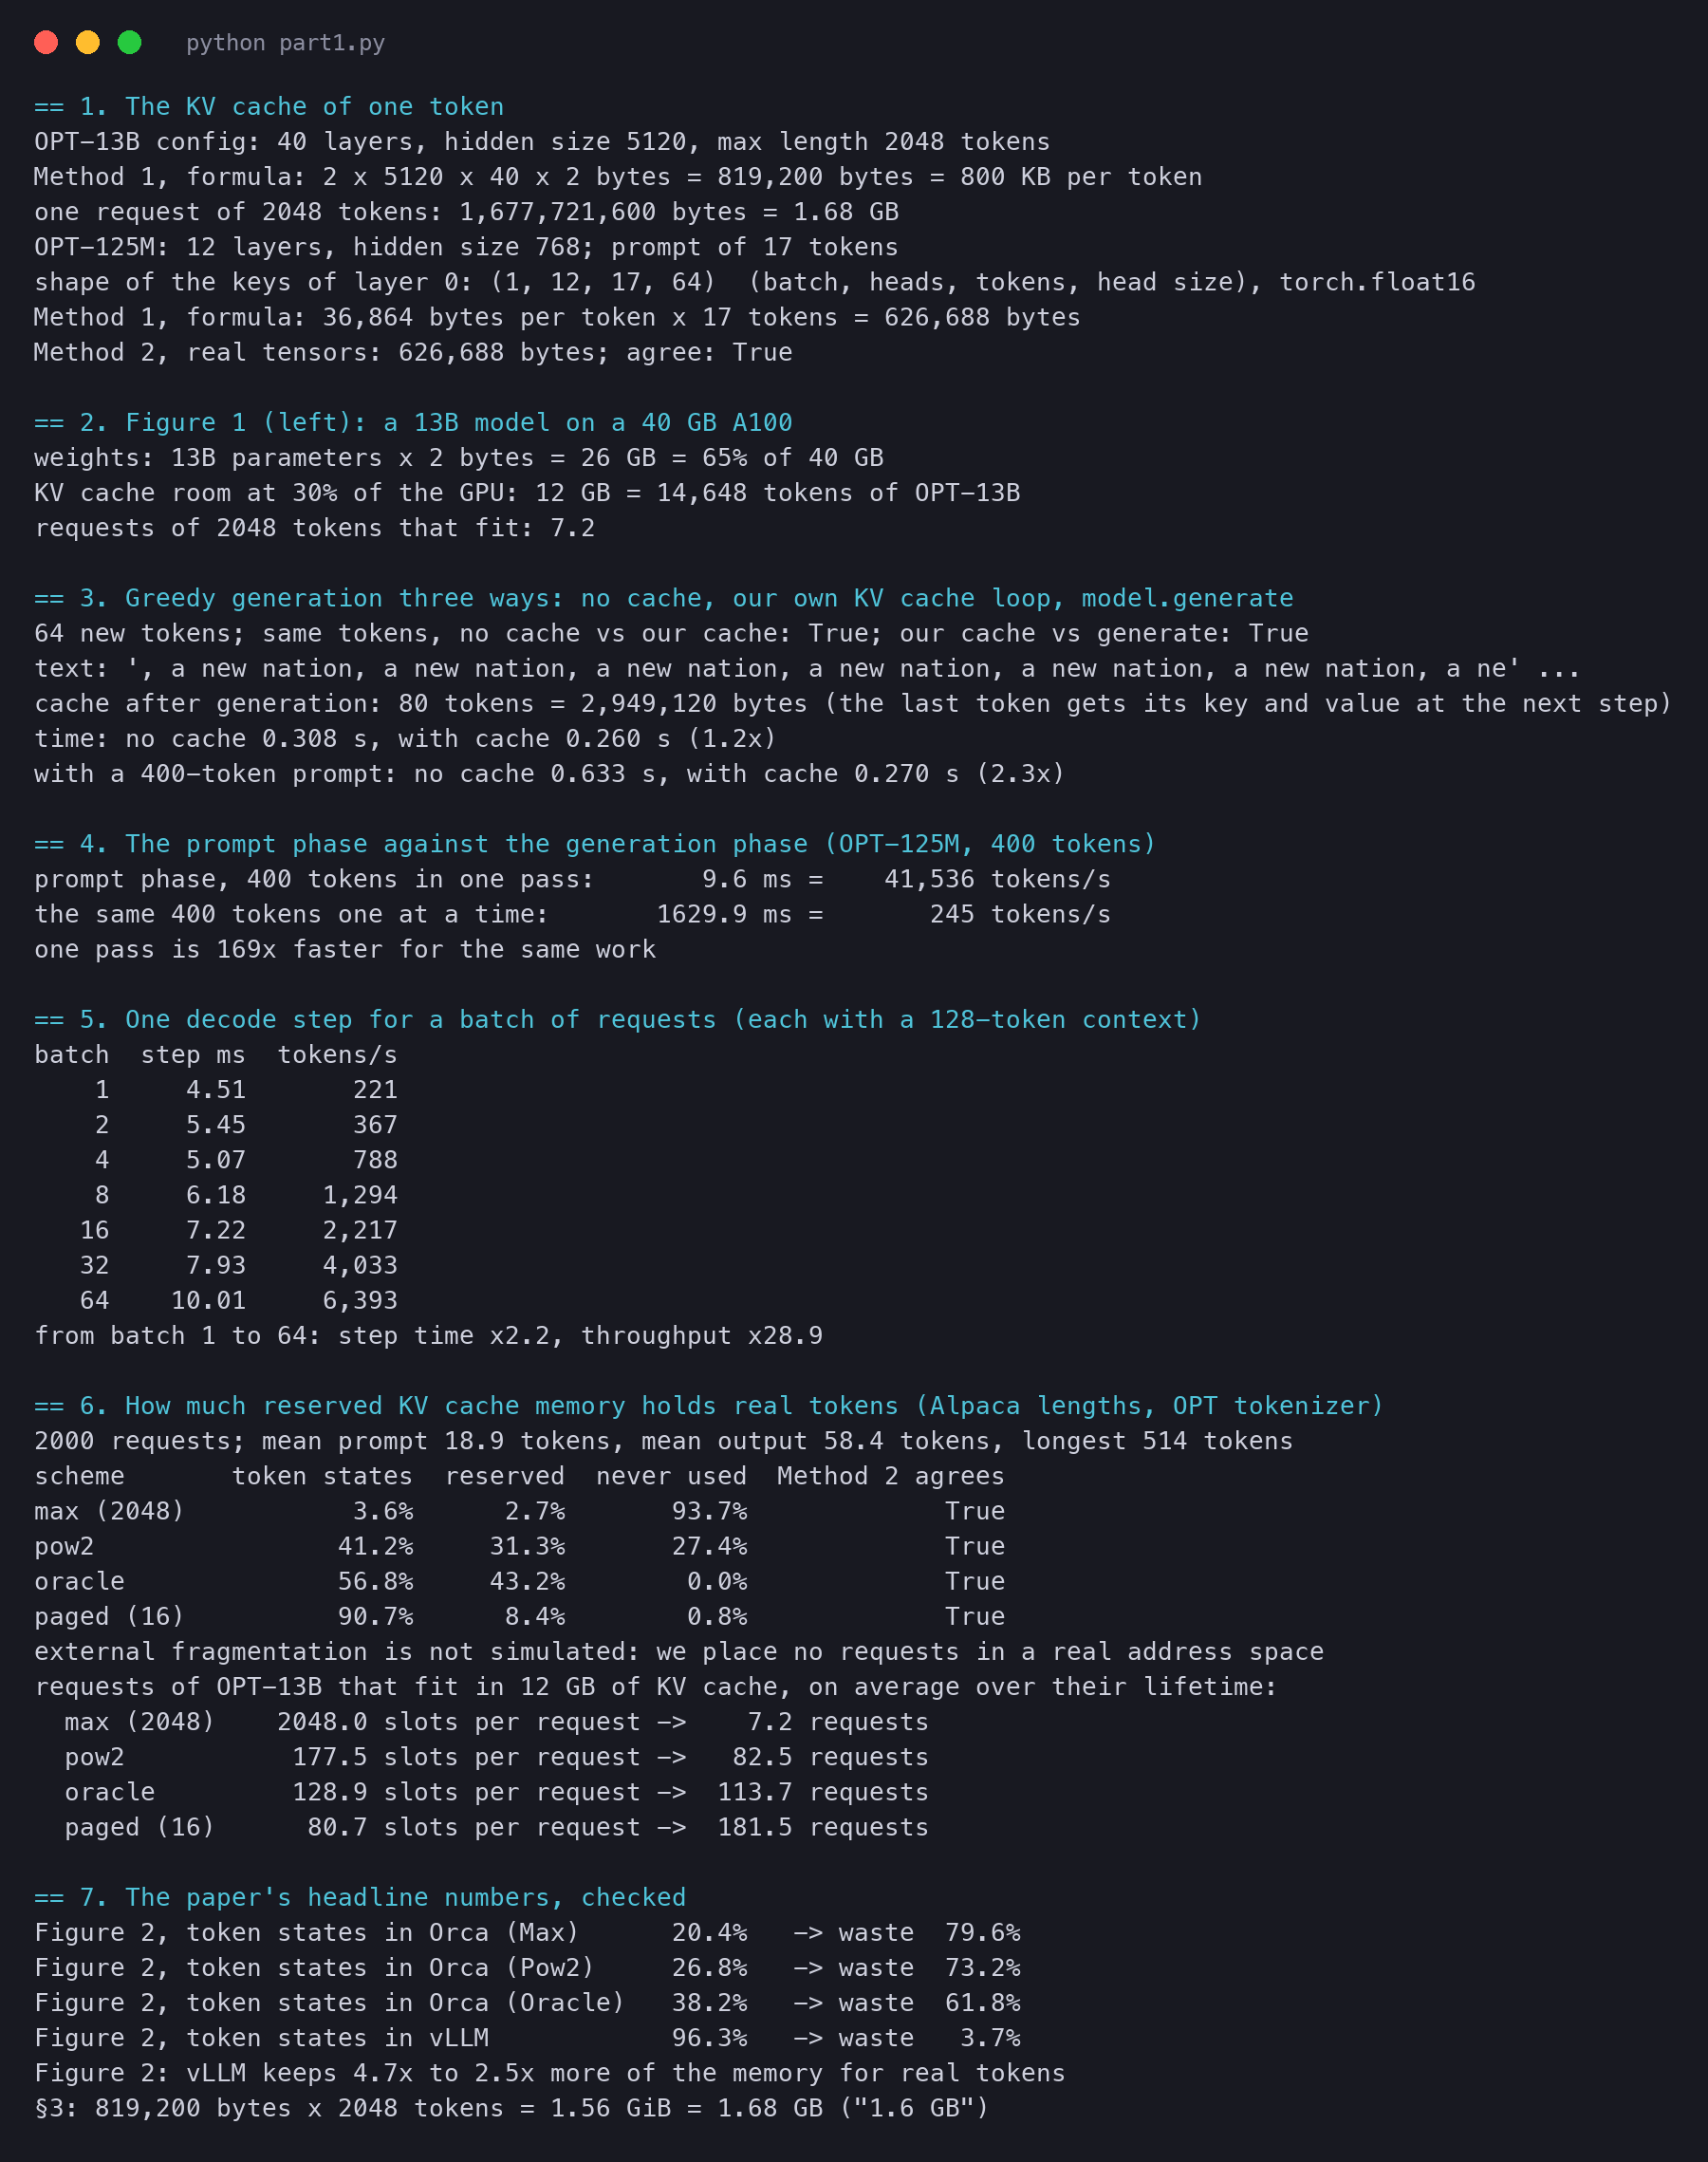
The three methods give the same 64 tokens, so the cache changes nothing about the answer. (A model of 125M parameters repeats itself; the text is not the point.) The time is what changes. With a short prompt the gain is small, 1.2 times, because each step of a tiny model is dominated by fixed costs. With a prompt of 400 tokens, the cache cuts the time by 2.3 times. The longer the context, the more work the cache saves.
So the cache trades memory for time. Every request keeps its keys and values in GPU memory for as long as it runs. The rest of the paper is about the memory side of that trade.
The KV cache of one request. The prompt phase writes the keys and values of all prompt tokens in one pass. Each step of the generation phase adds one more column.
We check this formula twice. Method 1 applies it to the real configuration file of OPT-13B. Method 2 runs OPT-125M on a prompt and adds up the bytes of the cache tensors that the library really keeps. If the formula is right, it predicts those bytes exactly:
python
def kv_bytes_per_token(cfg, bytes_per_value=2): """The paper's formula (§3): 2 (key and value) x hidden size x number of layers x bytes per FP16 number.""" return 2 * cfg['hidden_size'] * cfg['num_hidden_layers'] * bytes_per_valuedef cache_bytes(cache): """Method 2: add up the bytes of every key and value tensor that the library really keeps.""" return sum(t.numel() * t.element_size() for layer in cache.layers for t in (layer.keys, layer.values))
plain text
== 1. The KV cache of one tokenOPT-13B config: 40 layers, hidden size 5120, max length 2048 tokensMethod 1, formula: 2 x 5120 x 40 x 2 bytes = 819,200 bytes = 800 KB per tokenone request of 2048 tokens: 1,677,721,600 bytes = 1.68 GBOPT-125M: 12 layers, hidden size 768; prompt of 17 tokensshape of the keys of layer 0: (1, 12, 17, 64) (batch, heads, tokens, head size), torch.float16Method 1, formula: 36,864 bytes per token x 17 tokens = 626,688 bytesMethod 2, real tensors: 626,688 bytes; agree: True
The formula matches the real tensors to the byte. The shape shows where the "hidden size" goes: 12 attention heads of 64 numbers each make 768. The 800 KB of the paper is 819,200 bytes, which is 800 times 1,024. A full request of OPT-13B is 1.68 GB in decimal units, or 1.56 GiB; the paper rounds to "1.6 GB".
Now Figure 1's budget, as arithmetic. The 13B model takes 26 GB. Suppose the cache gets 30% of the card, 12 GB:
plain text
== 2. Figure 1 (left): a 13B model on a 40 GB A100weights: 13B parameters x 2 bytes = 26 GB = 65% of 40 GBKV cache room at 30% of the GPU: 12 GB = 14,648 tokens of OPT-13Brequests of 2048 tokens that fit: 7.2
Twelve gigabytes sounds large, but it holds only 14,648 tokens of OPT-13B. If every request books room for 2,048 tokens, only 7 requests fit. That matches the orange line of Figure 1, which hits the ceiling at a batch of about 8.
The paper's §2 names the two phases that we met in the chat request above. The prompt phase reads all prompt tokens in one pass. The generation phase writes one token per pass. We time both on the same 400 tokens. If the GPU is starved of data, the second way should be far slower:
plain text
== 4. The prompt phase against the generation phase (OPT-125M, 400 tokens)prompt phase, 400 tokens in one pass: 9.6 ms = 41,536 tokens/sthe same 400 tokens one at a time: 1629.9 ms = 245 tokens/sone pass is 169x faster for the same work
The work is the same, but one pass is 169 times faster. In one pass, the GPU reads the weights once and uses them for 400 tokens. One at a time, it reads them 400 times. On our laptop, part of each step is also the fixed cost of a call from Python. So the exact factor is larger than on a server GPU. The direction is the paper's point: the generation phase wastes the GPU.
Batching gives back what the generation phase loses. We run one decode step for 1 to 64 requests at once, each with 128 tokens of cache. The function below is one such step; after it, we cut the cache back, so every timed run does the same work. Watch the step time grow much more slowly than the batch:
python
def step():
    with torch.no_grad():
        model(step_in, past_key_values=cache, use_cache=True)
        for layer in cache.layers:                      # drop the token just added, so every run is the same
            layer.keys, layer.values = layer.keys[:, :, :CTX], layer.values[:, :, :CTX]
plain text
== 5. One decode step for a batch of requests (each with a 128-token context)batch step ms tokens/s 1 4.51 221 2 5.45 367 4 5.07 788 8 6.18 1,294 16 7.22 2,217 32 7.93 4,033 64 10.01 6,393from batch 1 to 64: step time x2.2, throughput x28.9
Our run: one decode step of OPT-125M on a laptop GPU. A batch of 64 takes 2.2 times as long as a batch of 1, but it writes 64 tokens instead of 1, so throughput grows 29 times.
Sixty-four requests take 2.2 times as long as one request, and they produce 64 tokens. So throughput grows 29 times. This is the bottom panel of Figure 1 on a small scale: throughput climbs with the batch size. On a real server, what stops the climb is the memory for all those caches. That is the subject of the rest of the paper. Our timings are the fastest of 7 runs on a laptop, so treat them as a shape, not as server numbers.
Contiguous chunks against blocks. Each request books one chunk for its longest possible answer, and gaps between chunks stay empty. With blocks, a request takes one small block at a time, wherever one is free.
We cannot run Orca, and we have no A100. But we can count where the memory goes under each booking rule, using the lengths of real requests. We take 2,000 random requests of Alpaca, one of the paper's two datasets. We measure their prompt and answer lengths with the OPT tokenizer. Then we walk each request through its life, token by token, and count three kinds of slots at every step:
python
SCHEMES = { # slots held, given current length, prompt and final length 'max (2048)': lambda cur, p, final: MAXLEN, 'pow2': lambda cur, p, final: p + 2 ** math.ceil(math.log2(final - p)), # output booked up to 2x (25 -> 32) 'oracle': lambda cur, p, final: final, f'paged ({BLOCK})': lambda cur, p, final: BLOCK * math.ceil(cur / BLOCK),}def simulate(alloc): """Method 1: walk every request step by step. At each step, count the slots that hold a token (used), the slots kept for tokens that will come later (reserved) and the slots that no token will ever fill (waste).""" used = reserved = waste = 0 for p, o in REQS: final = p + o for cur in range(p, final + 1): # after the prompt phase, then after each new token a = alloc(cur, p, final) used += cur fut = min(a, final) - cur # slots that a later token of this request will fill reserved += fut waste += a - cur - fut return used, reserved, waste
Each rule takes the current length, the prompt length and the final length of a request, and returns how many slots it holds. The first three book once, at the start, as the paper's three versions of Orca do. The power-of-two rule rounds the answer's length up, so an answer of 25 tokens books 32 slots. The paged rule books blocks of 16 slots, one more each time the last block is full.
Method 2 computes the same totals with a closed formula instead of the loop. The sum of the current lengths over the steps p,p+1,…,p+o is (o+1)(2p+o)/2, so no walk is needed. The two methods must agree to the slot:
plain text
== 6. How much reserved KV cache memory holds real tokens (Alpaca lengths, OPT tokenizer)2000 requests; mean prompt 18.9 tokens, mean output 58.4 tokens, longest 514 tokensscheme token states reserved never used Method 2 agreesmax (2048) 3.6% 2.7% 93.7% Truepow2 41.2% 31.3% 27.4% Trueoracle 56.8% 43.2% 0.0% Truepaged (16) 90.7% 8.4% 0.8% Trueexternal fragmentation is not simulated: we place no requests in a real address spacerequests of OPT-13B that fit in 12 GB of KV cache, on average over their lifetime: max (2048) 2048.0 slots per request -> 7.2 requests pow2 177.5 slots per request -> 82.5 requests oracle 128.9 slots per request -> 113.7 requests paged (16) 80.7 slots per request -> 181.5 requests
Our simulation on 2,000 Alpaca requests: the share of booked KV cache memory that holds a token, that waits for a later token, and that no token ever fills. Blocks of 16 slots keep 90.7% of the memory full.
The order is the paper's order: max, then power of two, then oracle, then paged. Alpaca requests are short, 77 tokens on average, so booking 2,048 slots is extreme here: only 3.6% of the memory holds tokens. Even the oracle keeps 43.2% blocked as reservation, because a request books its final length on its first step. Paged blocks keep 90.7% of the memory full. On average a request holds 80.7 slots instead of 2,048, so 181 requests fit where 7 did.
Our numbers differ from Figure 2, and the reasons are worth knowing. We place no chunks in a real address space, so we count no external fragmentation; that is why our oracle shows 56.8% instead of 38.2%. The paper's bars come from a running system with ShareGPT or Alpaca traffic, a scheduler and requests that arrive over time. Our paged share is below the paper's 96.3% because our requests are short. The half-empty last block of 16 slots is a larger part of each one. The lesson is the same: booking ahead is what wastes memory.
Here is what those counts mean for one real card. We take Figure 1's budget, 12 GB of KV cache space, and fill it with requests under the first rule and under the paged rule:
The same 40 GB GPU in our simulation. Before vLLM, 12 GB of KV cache space holds 7.2 chunks of 2,048 slots, and only 3.6% of it holds a token. With blocks of 16 slots, it holds 181.5 requests on average, and 90.7% of it holds a token.
The weights do not change, and neither does the card. Only the way the cache is booked changes, and the number of requests that fit grows from 7 to about 181. For these short Alpaca requests the gap is extreme. The paper's own measurement, with real traffic, is the 2 to 4 times of the abstract.
Three suggestions for one prompt. Before, each answer has its own chunk with its own copy of the prompt's cache. With vLLM, the three block tables all point to one shared copy of the prompt blocks.
Paging in an operating system and in vLLM. A program sees pages 0, 1 and 2 in order, and its page table maps them to scattered frames. A request sees blocks 0, 1 and 2, and its block table maps them to scattered GPU blocks.
The last section of our script turns Figure 2's percentages into ratios, so we can compare them with the claim of "2-4×". Look at the line that starts with "vLLM keeps":
plain text
== 7. The paper's headline numbers, checkedFigure 2, token states in Orca (Max) 20.4% -> waste 79.6%Figure 2, token states in Orca (Pow2) 26.8% -> waste 73.2%Figure 2, token states in Orca (Oracle) 38.2% -> waste 61.8%Figure 2, token states in vLLM 96.3% -> waste 3.7%Figure 2: vLLM keeps 4.7x to 2.5x more of the memory for real tokens§3: 819,200 bytes x 2048 tokens = 1.56 GiB = 1.68 GB ("1.6 GB")
These ratios explain the size of the headline claim. vLLM keeps 2.5 to 4.7 times more of the cache memory full of real tokens. More full memory means larger batches, and larger batches mean more throughput. The measured gain of "2-4×" sits inside that range. It cannot be the full ratio, because other limits, such as compute, start to matter when batches get large.
Our run measured the KV cache of a real model, checked the paper's formula to the byte, and showed that batching raises throughput. It did not run vLLM or Orca. The paper's PagedAttention kernel is CUDA code for NVIDIA GPUs, and our laptop has an Apple GPU. Our timings come from a model of 125 million parameters, where fixed costs per step are large. On an A100 with a 13B model, the numbers would differ, though the direction would not.
Our Figure 2 is a count, not a measurement of a running server. It has no external fragmentation, no arrival times and no scheduler. Part 6 builds a small paged cache and a serving loop that do allocate real blocks, so we can see the block table at work.
Next, in Part 2: §2 and §3 of the paper. Part 2 reads the attention equations behind the KV cache, the prompt and generation phases, and the batching methods of earlier systems. It then takes Figure 3 apart, slot by slot.
Run it yourself
The script behind this part is code/papers/vllm/vllm_part1.py. It loads OPT-125M and the OPT-13B configuration file, and measures the KV cache two ways. It times generation with and without a cache, the two phases and a batched decode step. Then it runs the memory simulation on 2,000 Alpaca requests. Every number is saved in results/part1.json. On an Apple M-series laptop it takes about two minutes.
bash
pip install torch transformers datasetspython vllm_part1.py # downloads facebook/opt-125m (about 250 MB), the OPT-13B config, and tatsu-lab/alpaca
The full output of vllm_part1.py, as it ran for this article.