SAM, explained · Part 5 of 6 · Covers §7, Figures 8 to 13, Tables 3 to 5, Appendix D, Appendix E
Zero-Shot Experiments: One Model, Five Tasks
The paper tests SAM on pictures and jobs that it never saw in training. We explain each score, and we repeat the tests in small on 40 objects drawn by people.
Segment Anything. Alexander Kirillov, Eric Mintun, Nikhila Ravi, Hanzi Mao, Chloe Rolland, Laura Gustafson, Tete Xiao, Spencer Whitehead, Alexander C. Berg, Wan-Yen Lo, Piotr Dollár, Ross Girshick. ICCV 2023, 2023. arXiv:2304.02643
A model that only works on its own training pictures is a good student of one textbook. Section 7 gives SAM an exam with questions from other books, and we sit a small copy of that exam with the released model.
The five experiments of §7. The core test gives SAM one point and expects one valid mask. The four new tasks climb from low-level to high-level vision. In every row, the weights are the same; only the prompts change.
Part 1 explained IoU with two sheets of tracing paper. One IoU grades one mask. A benchmark has thousands of masks, so it needs one number for all of them. The simplest choice is the average, as a teacher averages the marks of a class.
mIoU=N1i=1∑NIoU(Mi,Gi),IoU(M,G)=∣M∪G∣∣M∩G∣
Read it from the right. Gi is the ground-truth mask of object i, drawn by a person. Mi is the mask that the model gives for it. ∣M∩G∣ counts the pixels in both masks, and ∣M∪G∣ counts the pixels in at least one. N is the number of objects, and the sum adds their IoUs.
A tiny example with three objects. SAM gets IoU 0.9 on a cup, 0.8 on a dog and 0.1 on a shirt, where it gave the whole person. The mIoU is (0.9+0.8+0.1)/3=0.600. One ambiguous click pulls the class average down by a third. This is why the paper says "low absolute mIoU at 1 point is the result of ambiguity".
The paper averages twice: first over the objects of one dataset, then over the 23 datasets. So a small dataset counts as much as a large one.
The paper does not let a person click. A person clicks in a different place each time, so two runs of the benchmark would differ. Instead, a fixed rule chooses the point, the same rule as earlier papers on interactive segmentation:
The rule fits in one line:
p1=argp∈Gmaxd(p,∂G)
G is the ground-truth mask, ∂G is its boundary, and d(p,∂G) is the distance from pixel p to the nearest boundary pixel. argmax returns the pixel, not the distance. For the later points, replace G by the larger of the two error blobs.
A tiny example: a mask of 5 rows and 7 columns. The distance transform counts the steps to the outside. The outer ring of pixels gets 1, the next ring gets 2, and the middle row gets 3:
The largest value, 3, sits in the middle row. Our code takes the first of the tied pixels; the real distance transform uses straight-line distances, so ties are rare.
We cannot run the paper's 23 datasets. We built a small honest copy. The photos and masks come from COCO, a public dataset of everyday scenes with masks drawn by people. We read it from Hugging Face with no login. We took the first 16 pictures, and in each picture up to 4 objects at random, all larger than 24 × 24 pixels:
plain text
COCO panoptic val2017 (Hugging Face nielsr/coco-panoptic-val2017), the first 16 imagesobjects: 40 from 13 images (up to 4 per image, chosen at random, area >= 576 px = 24 x 24)object size: smallest 664 px, median 7,343 px, largest 275,827 pxcategories: person 14, chair 3, teddy bear 3, refrigerator 2, potted plant 2, tennis racket 2, backpack 2, tv 1, bear 1, book 1, stop sign 1, bed 1, skis 1, oven 1, baseball glove 1, bird 1, boat 1, handbag 1, cell phone 1
That is 40 objects, against about 10,000 masks for each of the paper's datasets. Our numbers can show the effects that the paper describes. They cannot rank SAM against other models, and the error of a mean over 40 objects is large. COCO is also not new to every model: RITM trained on it, and LVIS uses its photos. SAM never trained on it.
For each object, we placed the center point, gave it to SAM ViT-H, and kept all three masks. Here are a few rows of the output:
plain text
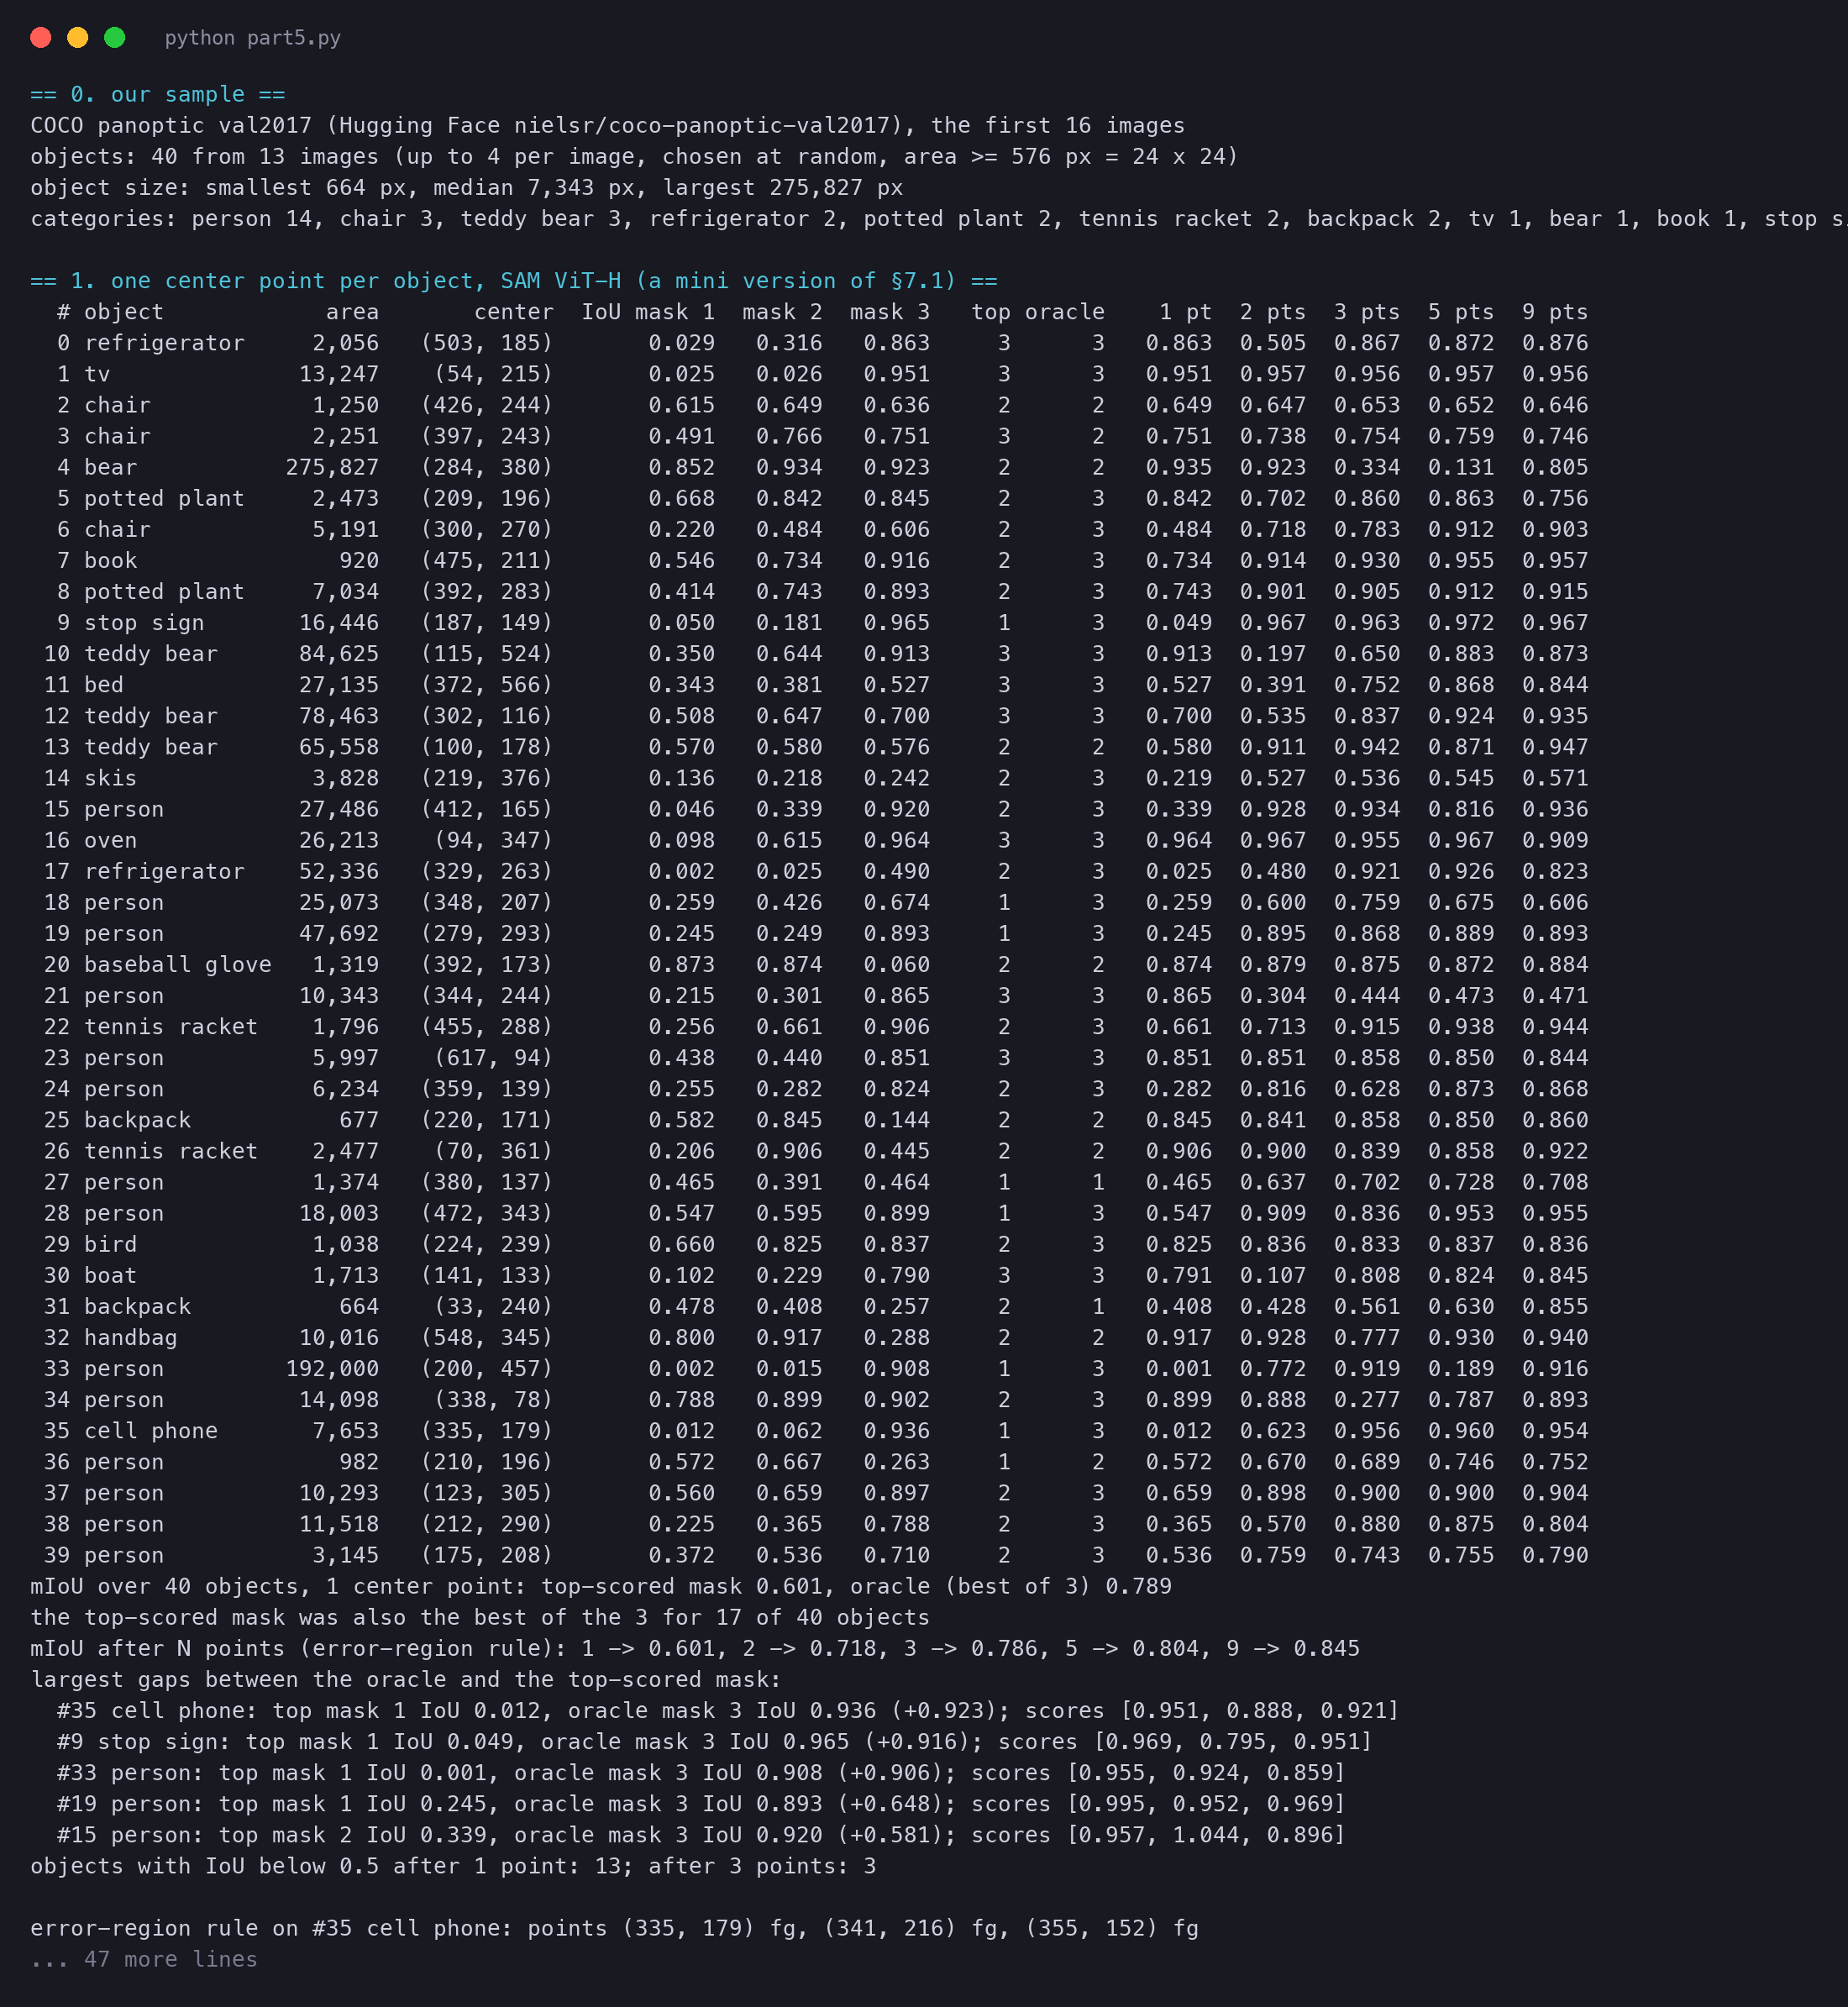
# object area center IoU mask 1 mask 2 mask 3 top oracle 1 pt 1 tv 13,247 (54, 215) 0.025 0.026 0.951 3 3 0.951 9 stop sign 16,446 (187, 149) 0.050 0.181 0.965 1 3 0.049 35 cell phone 7,653 (335, 179) 0.012 0.062 0.936 1 3 0.012mIoU over 40 objects, 1 center point: top-scored mask 0.601, oracle (best of 3) 0.789the top-scored mask was also the best of the 3 for 17 of 40 objects
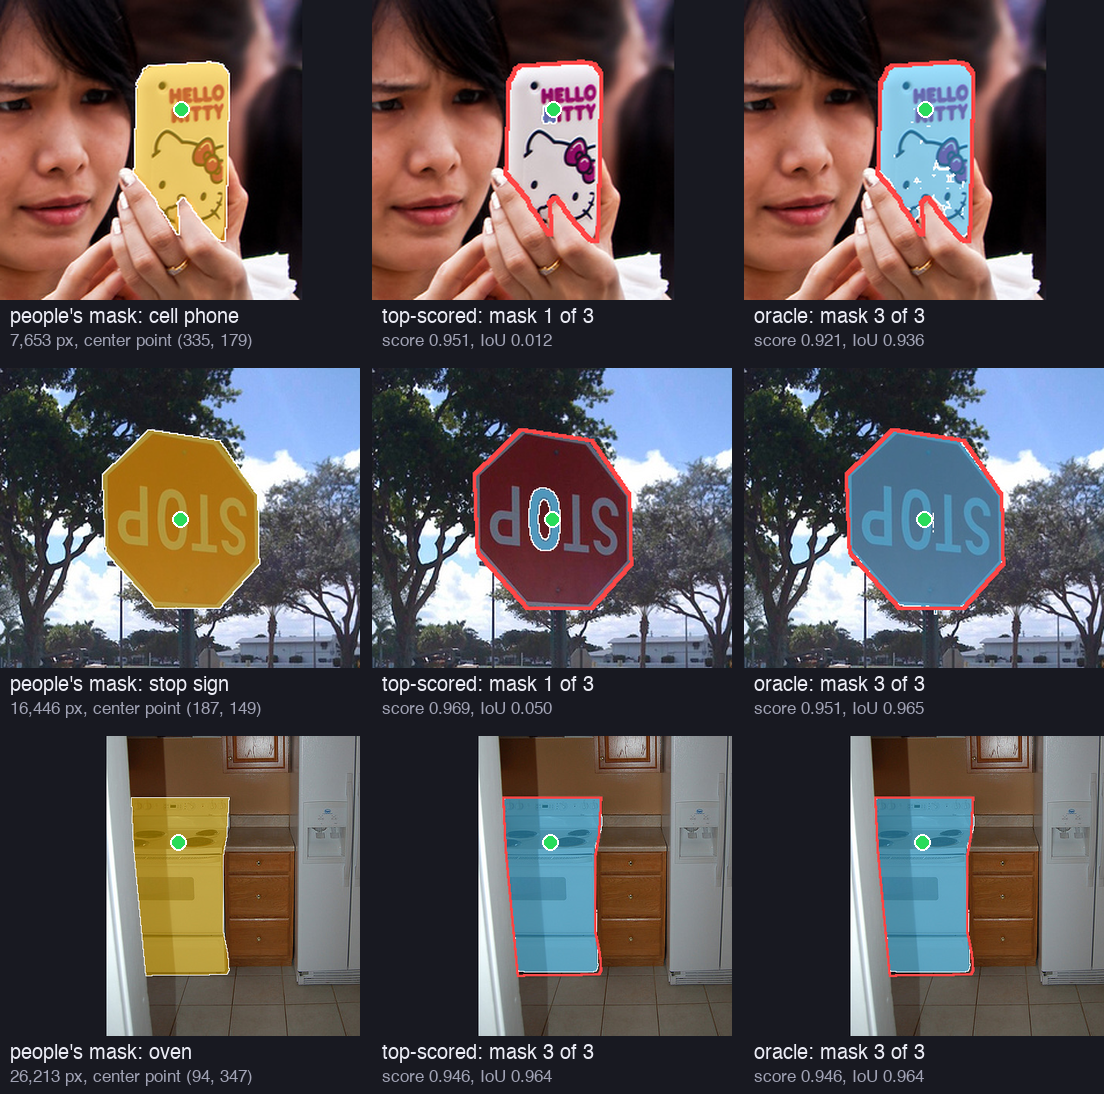
For the TV, SAM ranked mask 3 first, and mask 3 matches the TV (IoU 0.951). For the stop sign and the cell phone, SAM ranked mask 1 first: a small part. For the stop sign, it is the letter O under the click. Its IoU with the full object is 0.049 for the sign and 0.012 for the phone. Mask 3 was the whole object both times, with IoU 0.965 and 0.936.
M1,M2,M3 are SAM's three masks and s^k is SAM's own score for mask k, the predicted IoU of Part 3. The top mask is the one with the highest score; the oracle mask is the one with the highest true IoU. They are the same mask only when SAM's own ranking agrees with the ground truth. For the stop sign, the three IoUs are 0.050, 0.181 and 0.965. SAM ranked mask 1 first, so the top IoU is 0.050 and the oracle IoU is 0.965.
On our 40 objects, the oracle lifts the mIoU from 0.601 to 0.789. The top-scored mask was also the best mask for only 17 objects. The figure shows every object:
Our 40 COCO objects with one center point and SAM ViT-H. For each object, orange is the IoU of the mask with the highest score and green is the best of the three masks. For many objects, the best mask is near 0.9 while the top-scored mask is far lower. The means are 0.601 and 0.789.
The pictures show three objects. In the first two rows, SAM ranked a small part first. In the last row, the top mask and the oracle are the same mask:
One center point (green) per object. Left: the mask that people drew. Middle: SAM's top-scored mask (blue; the red line is the people's outline). Right: the oracle, the best of the three masks. The top-scored mask can be a valid part of the object, but the dataset wanted the whole object.
Does this mean that SAM is wrong? Not always. The letter O is a valid answer to a click on the letter O. COCO's annotators chose the whole phone. The automatic score cannot tell "wrong" from "a different valid answer". The human study can.
Appendix E explains why the team paid for this study, and how they ran it:
Figure 18 in the appendix gives the mean ratings for each dataset. We drew them in one chart:
The mean ratings of the human study (Figure 18 of the paper). On every dataset, SAM is above RITM, by 1.1 to 2.2 points. The masks drawn by people are still higher. On OVIS, the legend gives single-output SAM a higher mean (7.7) than SAM (7.2).
SAM sits between RITM and the masks drawn by people. On LVIS, VISOR, IBD and NDD20, it is within 0.4 of the people. Look at OVIS: the legend of Figure 18 gives 7.2 for SAM and 7.7 for single-output SAM. Table 8 of the same appendix reports that SAM is significantly above single-output SAM on OVIS. The paper does not explain the difference, so we report both numbers as printed.
The error bars in panel (b) are 95% confidence intervals. Each one is the range that holds the true mean with 95% confidence, given the 1,000 sampled masks. With 1,000 ratings per bar, the intervals are narrow, from ±0.06 to ±0.17 in the legends. So differences of a whole point are not luck.
We ran the same protocol on our 40 objects. The paper does not say whether the earlier mask goes back in as a mask prompt, so we ran both ways:
plain text
mIoU after N points (error-region rule): 1 -> 0.601, 2 -> 0.718, 3 -> 0.786, 5 -> 0.804, 9 -> 0.845variant: the previous mask logits also go back in as a mask prompt: 1 -> 0.601, 2 -> 0.774, 3 -> 0.844, 5 -> 0.866, 9 -> 0.884random first point (Figure 9d): 1 -> 0.604, 2 -> 0.704, 3 -> 0.793, 5 -> 0.860, 9 -> 0.841, oracle at 1 point 0.809
Mean IoU on our 40 objects as the points accumulate. With the previous mask as an extra prompt (green), one more point lifts the mIoU from 0.601 to 0.774, and nine points reach 0.884. With points only (blue), the curve is lower. A random first point (orange, points only) gives about the same curve as the center point on our small sample.
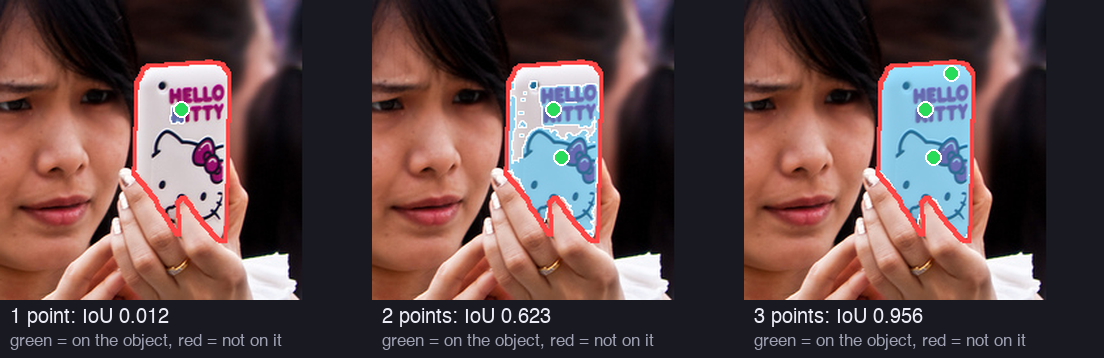
The second point does most of the work: it fixes the wrong level of the nest. The cell phone is a clear case. Its first mask was a tiny piece of the print, so almost the whole phone was error region. The second point landed in the middle of that region, at (341, 216), and the IoU went from 0.012 to 0.623.
With points only, the curve is not smooth for every object. The large bear went from 0.935 after one point to 0.334 after three, then back to 0.805 after nine. Each extra point is a new question, and without its last answer SAM can change its mind. With the previous mask as a prompt, SAM keeps its last answer and corrects it, as in the training game of Part 3. This is why the mask-prompt curve is higher.
The error-region rule on the cell phone, with points only. Each new point (green) lands in the center of the largest missed region. The IoU goes from 0.012 to 0.623 to 0.956. The red line is the mask in COCO.
Our random first point did not start lower: 0.604 against 0.601 for the center point. The paper's effect is clear on 23 datasets, with about 10,000 masks each. On 40 objects, the luck of 40 random clicks is as large as the effect. COCO's objects are also mostly compact, so a random point inside them is rarely near a thin part. This is the limit of a small sample, and we report it as it came out.
The Sobel filter is from 1968, the oldest row of Table 3. It measures how fast the brightness changes. It slides two small tables of weights over the picture:
I is the picture (here, one mask's probability map), and ∗ means "slide the table over the picture and take the weighted sum at each place". Sx∗I is the change from left to right; Sy∗I is the change from top to bottom. E combines them into one strength, whatever the direction of the edge.
A tiny example. Three columns of a probability map read 0.0, 0.5, 1.0 in all three rows. Sx gives (−1−2−1)×0.0+(1+2+1)×1.0=4.0 at the middle column. Sy gives 0, because nothing changes from top to bottom. So E=4.0 there: a strong vertical edge. On a flat region of all 1.0, both are 0.
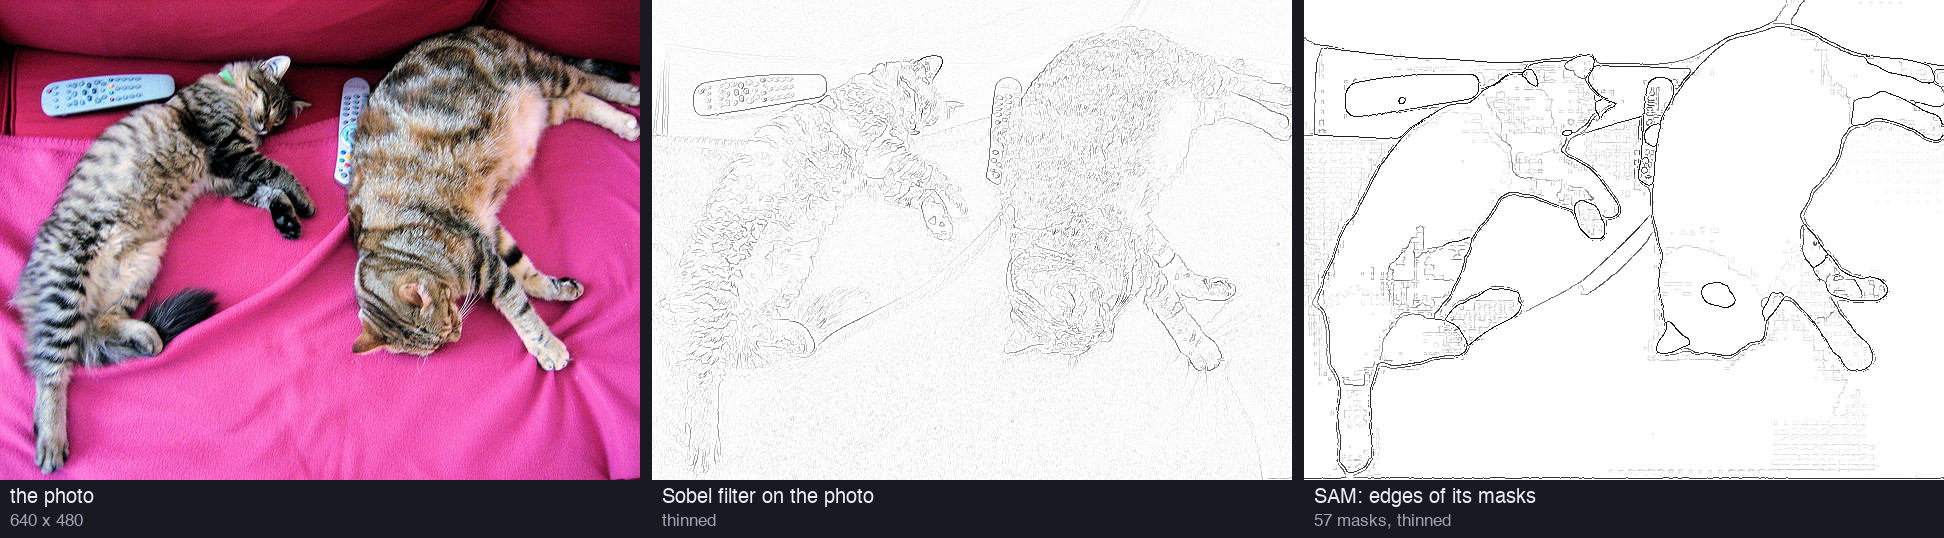
We built this pipeline on the cat photo of the earlier parts. We have no BSDS500 here, so there is no score, only a picture. We compared it with the Sobel filter applied to the photo itself, the 1968 baseline:
plain text
16 x 16 grid -> 768 masks (3 per point), no filter by predicted IoU or stability; 57 left after box NMS 0.7SAM edge map: 17,338 edge pixels above 0.1 after thinning; Sobel on the photo: 33,837
Only 57 of the 768 masks survive NMS. The cat photo has few objects, so most points repeat a mask of a cat, a remote or the blanket. After thinning, the Sobel filter on the photo marks 33,837 pixels above 0.1, and SAM's map marks 17,338, about half.
Left: the photo. Middle: the Sobel filter on the photo, thinned. It marks every change of brightness, including the texture of the blanket and the fur. Right: the edges of SAM's masks, thinned. It marks the borders between things. The dotted patches on the fur come from masks with ragged edges there.
The difference is the whole point of the experiment. The Sobel filter on the photo sees brightness, so every stripe of fur is an edge. The Sobel filter on SAM's masks sees things, because each mask is a thing. Our code follows Appendix D.2; the box-NMS threshold (0.7) and the exact edge-NMS settings are our choices, because the paper does not give them.
Precision P asks "of what I marked, how much was right?". Recall R asks "of what was there, how much did I find?". The F-score combines them, and it is high only when both are high. A predicted pixel counts as "found" if it lies within a small distance of a human edge.
A tiny example. The people drew 100 edge pixels. A model marks 150 pixels, and 90 of them match. Then P=90/150=0.60, R=90/100=0.90, and F=2×0.60×0.90/1.50=0.72. A model that marks more edges raises R and lowers P. That is SAM's profile.
An edge map is grey, not black and white, so a threshold decides which pixels count as "marked". Each metric handles the threshold differently:
ODS (optimal dataset scale): one threshold for the whole dataset, the one that gives the best F. Report that F.
OIS (optimal image scale): the best threshold for each picture separately. It is always at least the ODS.
AP (average precision): sweep all thresholds, draw precision against recall, and take the area under the curve.
R50: the recall at the threshold where precision is 50%.
So R50 rewards a model that finds every edge even with many false alarms, and ODS punishes those false alarms. SAM's high R50 and lower ODS tell the same story as the picture: SAM finds more edges than people draw.
Average recall is recall, averaged over strictness. An object counts as "found" if some proposal overlaps it with an IoU of at least t. Then:
AR@1000=101t∈{0.50,0.55,…,0.95}∑Recall(t),Recall(t)=#{objects}#{objects with a proposal of IoU≥t}
"@1000" means that only the top 1,000 proposals of each picture count. t takes 10 values, from loose (0.50: half the overlap is enough) to strict (0.95: almost exact). The average over t rewards a proposal method that finds objects and outlines them well.
A tiny example with 4 objects. The best proposals have IoUs of 0.97, 0.82, 0.66 and 0.40 with them. From t=0.50 to 0.65, three objects are found: recall 0.75. From t=0.70 to 0.80: two, recall 0.50. From t=0.85: one, recall 0.25. The ten recalls are 0.75, 0.75, 0.75, 0.75, 0.50, 0.50, 0.50, 0.25, 0.25, 0.25, and their mean is AR = 0.525.
We ran a small version on all objects of our 13 COCO pictures. To save time, we used a grid of 32 × 32 points, not 64 × 64, with the same NMS threshold, ranking and limit:
plain text
image 139: 3,072 masks -> 430 after box NMS 0.9; 20 objects drawn by people image 285: 3,072 masks -> 165 after box NMS 0.9; 1 objects drawn by people ... image 1503: 3,072 masks -> 293 after box NMS 0.9; 5 objects drawn by peopleground-truth objects: 111 (small 41, medium 40, large 30); proposals per image: mean 306recall at each IoU threshold (top 1000): 0.50 0.820, 0.55 0.793, 0.60 0.748, 0.65 0.730, 0.70 0.667, 0.75 0.622, 0.80 0.568, 0.85 0.441, 0.90 0.234, 0.95 0.072AR@1000 = mean of the 10 recalls = 0.569 (AR@100 = 0.458)AR@1000 by size: small 0.329, medium 0.647, large 0.793
Recall of our SAM proposals at each of the ten IoU thresholds. At 0.50, almost every object has a matching proposal. At 0.95, few proposals are almost exact. Average recall is the mean of the ten bars.
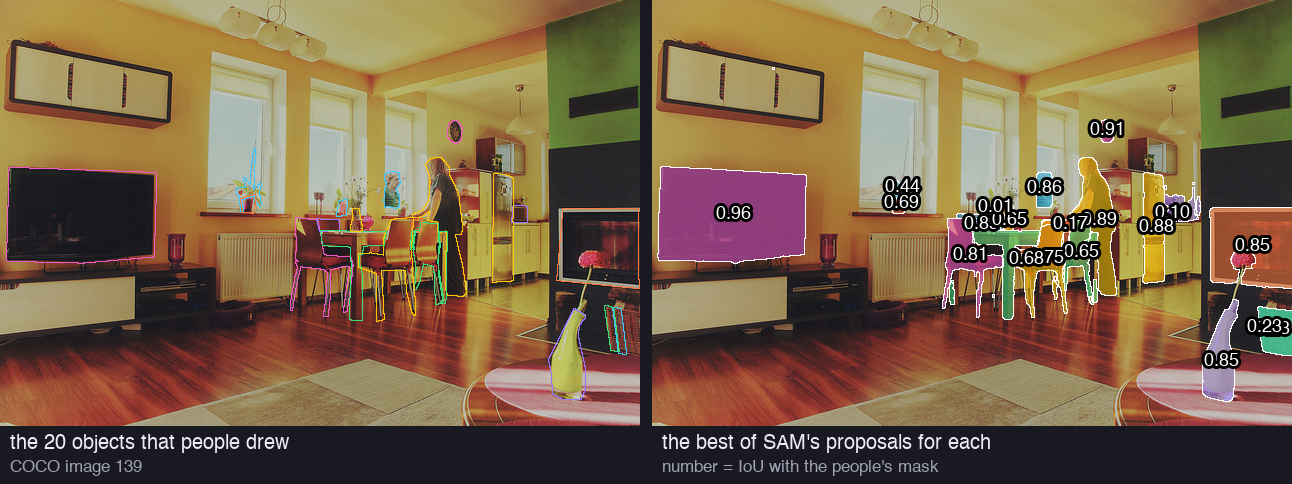
Our grid gives 3,072 masks per picture, and NMS leaves between 143 and 560 (306 on average). So our "AR@1000" never reaches its limit of 1,000; the paper's denser grid gives about 900. Even so, 82% of the 111 objects have a proposal with IoU at least 0.5. At the strict end, only 7.2% have a proposal with IoU at least 0.95. Part of that is COCO itself: its polygons are coarse, and a crisp SAM mask cannot match them pixel for pixel.
Our AR@1000 is 0.569, and the pattern by size is the paper's pattern: small objects 0.329, medium 0.647, large 0.793. The paper reports 59.3 on LVIS, in percent. Our 13 pictures, our sparser grid and COCO's masks make the two numbers different experiments, so we do not compare them directly.
Left: the objects that people drew in one of our COCO pictures. Right: for each object, the best of SAM's proposals, with its IoU. SAM was told nothing about these objects; the grid of points found them.
Mask AP is the standard score of instance segmentation. It uses the precision and recall of the edge section, but for objects. The detector gives each mask a confidence, and we sort all masks of the dataset by it.
Now walk down the list. A mask is a "hit" if its IoU with a true object of its category is at least t. That object must not have a hit yet. Otherwise it is a false alarm. At each step, compute precision and recall so far. The average precision is the area under the precision-recall curve:
APt=∫01Pt(R)dR,AP=101t∈{0.50,…,0.95}∑APt
Pt(R) is the precision at recall R with IoU threshold t. The integral is the area under that curve, a number from 0 to 1. COCO then averages over the same ten thresholds as AR, and over the categories, and reports it in percent. APS, APM and APL are the same score for small, medium and large objects only.
A tiny example at t=0.5, with 2 true objects and 3 predicted masks in order of confidence. The first is a hit: precision 1/1, recall 1/2. The second is a false alarm: precision 1/2, recall 1/2. The third is a hit: precision 2/3, recall 2/2.
The usual rule takes, at each recall, the best precision at that recall or higher. So the curve is 1.0 up to recall 0.5, then 2/3 up to recall 1.0. The area is 0.5×1.0+0.5×0.667=0.833.
The mask's IoU enters through t. At t=0.95, a mask must match the reference almost pixel for pixel. If the reference has loose polygon edges, a crisp mask fails this test, and a mask that copies the loose style passes.
We could not run ViTDet, so we took the true COCO boxes as prompts. The human study of Figure 11 also used true boxes, from LVIS. We scored SAM's masks with IoU against COCO's masks, before and after the refinement pass:
plain text
mIoU with the box prompt: 0.808; after one refinement pass (mask + box back in): 0.823refinement helped 26 objects, hurt 13lowest box IoUs: #11 bed 0.003; #14 skis 0.528; #2 chair 0.651; #6 chair 0.660
A box is a much clearer prompt than a point. The mIoU rises from 0.601 with one center point to 0.808 with the box, and the refinement pass adds 0.015, to 0.823. It helped 26 objects and hurt 13: a small, real gain on average, not a gain on every object.
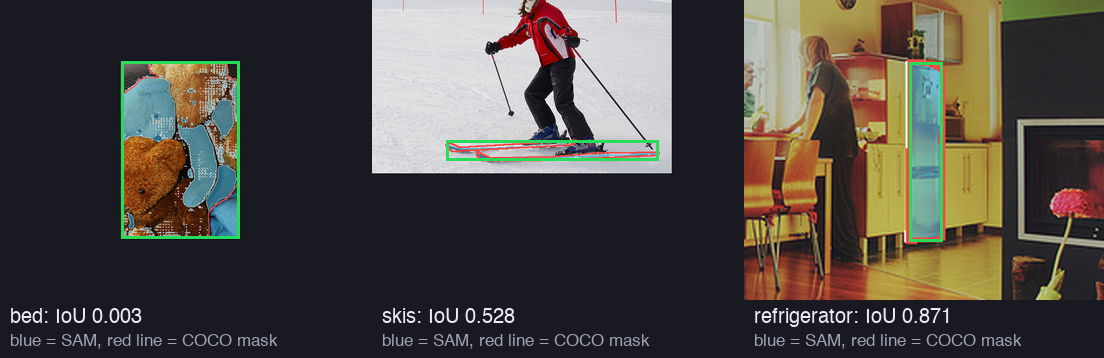
The true box (green) as the prompt. Blue: SAM's mask after the refinement pass. Red line: the mask in COCO. Left and middle: our two lowest IoUs. Right: an object with the median IoU.
The lowest score is a lesson in ambiguity of a different kind. The "bed" in this COCO picture is almost hidden under teddy bears, so its box is full of bears. SAM gave this mask a low score, 0.569, and the refinement moved the mask further away (IoU 0.077, then 0.003). The skis are thin and cross each other, so a small shift at the edge costs much IoU. On the refrigerator, at the median, look at the red line: COCO's polygon cuts a straight edge, and SAM follows the real one.
This is the one experiment that we cannot repeat. The released SAM weights have no text prompt: the model was trained without this CLIP path, and the text-trained version was not published. So we show no text result. Part 6 returns to text as one of SAM's limits.
Our mini test with the three released image encoders, one center point on our 40 COCO objects. Orange: the top-scored mask. Green: the oracle.
The oracle column repeats the paper's shape. It rises from ViT-B to ViT-L (0.746 to 0.791) and then stays flat (0.789 for ViT-H). So the larger encoders already have the right mask. The top-scored column keeps rising (0.505, 0.555, 0.601): on our sample, the larger encoder ranks its three masks better. With three or five points, the order is mixed, and the differences are smaller than the noise of 40 objects. The paper's 23 datasets settle what our sample cannot.
Next, in Part 6: the paper's discussion and limits. What SAM changed, where it fails, and what came after it.
Run it yourself
The script code/papers/sam/sam_part5.py reads 16 COCO pictures from Hugging Face. It places the center point of each of 40 objects by a distance transform and scores SAM's top-scored and oracle masks. It adds points by the error-region rule, prompts with the true boxes, makes proposals from a grid of points and computes the average recall. It also draws edge maps from SAM's masks, and repeats the point test with ViT-B and ViT-L. Every number of this part is in results/part5.json and results/part5_stdout.txt.
bash
pip install torch transformers datasets pillow scipy opencv-pythonpython sam_part5.py # uses facebook/sam-vit-base, -large and -huge, and about 140 MB of COCO data
The first part of the output of sam_part5.py, as it ran for this article.